|
Scientific Paper / Artículo Científico |
|
|
|
|
https://doi.org/10.17163/ings.n35.2026.06 |
|
|
|
pISSN: 1390-650X / eISSN: 1390-860X |
|
|
AUTOMATIC CLASSIFICATION OF ELECTRICAL COMPLAINTS USING DECISION TREES AND RANDOM FOREST: AN APPLIED STUDY AT CNEL EP |
||
|
CLASIFICACIÓN AUTOMÁTICA DE RECLAMOS ELÉCTRICOS MEDIANTE ÁRBOLES DE DECISIÓN Y RANDOM FOREST: UN ESTUDIO APLICADO A CNEL EP |
||
|
Francisco Javier
Carpio Velasco1,* |
|
Received: 03-10-2025, Received after review: 11-11-2025, Accepted: 18-11-2025, Published: 01-01-2026 |
|
Abstract |
Resumen |
|
This study presents an automated classification system to prioritize electrical service complaints at CNEL EP. A total of 143,113 real records were processed through data cleaning, missing-value imputation, and the engineering of predictive variables reflecting complaint urgency and recurrence. Based on these criteria, the target variable “Priority” was defined to distinguish high-priority from normal complaints. Supervised learning models, specifically Decision Tree and Random Forest, were then trained using one-hot encoding and cross-validation. Random Forest delivered the best performance, achieving 91% accuracy and an AUC-ROC of 0.89. These results indicate that the proposed system can significantly improve technical resource allocation and reduce response times for electrical complaints. Moreover, the study demonstrates the feasibility of integrating machine-learning techniques into the operational management of electric distribution companies, enabling future enhancements and real-time deployment. |
Este estudio presenta un sistema de clasificación automática destinado a priorizar reclamos eléctricos en CNEL EP. Para ello se procesaron 143 113 registros reales, incluyendo limpieza de datos, imputación de valores faltantes y la creación de variables predictivas relacionadas con la urgencia y la recurrencia de los reclamos. A partir de estos criterios se construyó la variable objetivo “prioridad”, que permite distinguir entre reclamos prioritarios y normales. Con esta información se entrenaron modelos de aprendizaje supervisado—árbol de decisión y random forest— aplicando técnicas como one-hot encoding y validación cruzada. El modelo random forest obtuvo los mejores resultados, con una exactitud del 91 % y un AUCROC de 0.89. Los resultados muestran que el sistema propuesto puede mejorar significativamente la asignación de recursos técnicos y los tiempos de respuesta ante reclamos eléctricos. Además, demuestra la viabilidad de incorporar técnicas de aprendizaje automático en la gestión operativa de empresas distribuidoras de electricidad, abriendo posibilidades para futuras mejoras y aplicaciones en tiempo real. |
|
Keywords: electrical complaints, automatic classification, supervised learning, Decision Tree, Random Forest, machine learning |
Palabras clave: reclamos eléctricos, clasificación automática, aprendizaje supervisado, árbol de decisión, random forest, aprendizaje automático |
|
1,*Facultad de Ciencias de la Ingeniería, Universidad
UTE, Santo Domingo de los Tsáchilas, Ecuador. Corresponding author ✉: francisco.carpio@ute.edu.ec.
Suggested citation: F.J. Carpio Velasco and G.M. Garcés Beltrán “Automatic classification of electrical complaints using decision trees and random forest: an applied study at CNEL EP,” Ingenius, Revista de Ciencia y Tecnología, N.◦ 35, pp. 78-89, 2026, doi: https://doi.org/10.17163/ings.n35.2026.06. |
|
1. Introduction
The growing complexity of the electrical sector requires the adoption of knowledge-management tools and intelligent technologies that enhance operational decision-making and optimize customer service [1]. In this context, multiple studies have shown that structured service classification can guide sustainability and efficiency strategies in both industrial and social settings [2]. In the electrical sector, customer classification through clustering techniques has been widely investigated, with studies highlighting algorithms such as k-means, fuzzy clustering, and self-organizing maps. These methods enable the identification of consumption patterns and the segmentation of technical services [3, 4]. Their effectiveness has been validated in real-world applications, where they have demonstrated a strong capacity to improve resource allocation and operational response. The prioritization of electrical complaints can be guided by studies that estimate customer interruption costs, distinguishing economic impacts according to the type of service disruption [5]. Similarly, the use of electrical data for automated inference has been examined in studies showing that relevant properties can be detected from consumption traces using supervised classification algorithms [6]. Efficient handling of electrical complaints directly influences customer satisfaction, as evidenced by recent studies in Latin American contexts [7]. In Ecuador, substantial concentrations of complaints have been documented in provinces such as Manabí, where consumers reported tariff increases higher than those observed in other cities such as Guayaquil [8]. Additionally, applied research in CNEL EP has identified deficiencies in service perception, underscoring the need to strengthen mechanisms for addressing external users’ requests [9]. During the pandemic, excessive billing practices intensified, motivating proposals for agile service mechanisms [10]. In Ecuador, the quality of technical service has been evaluated using indicators such as FMIk and TTIk, which enable the identification of critical areas and justify the need for operational prioritization [11]. At the international level, cases such as Cartagena, Colombia, have shown that deficiencies in electrical service can trigger social tensions and community conflicts [12]. The quality of electrical service has been identified as a key determinant of customer satisfaction and loyalty, particularly in public monopoly contexts [13]. However, recent evidence indicates that perceived quality, evaluated through SERVQUAL dimensions, does not always translate into customer satisfaction, as shown in |
the case of IBEDC in Nigeria [14]. Similarly, staff customer orientation has been found to significantly shape service perception, as evidenced by studies conducted in Ghana [15]. In modern electrical networks, fault identification and classification are critical for ensuring operational stability. Advances in intelligent sensors and communication technologies have transformed traditional systems into smart grids capable of integrating distributed generation and automation. Sarathkumar et al. [16] note that current fault-detection and mitigation methods require a thorough review to address the limitations of intelligent systems, and they propose advanced technologies that enhance transient stability, self-recovery capability, and power-supply quality. The incorporation of deep neural networks into electrical systems has proven an effective strategy for enhancing fault detection and classification. Alhanaf et al. [17] propose methods based on artificial neural networks (ANN) and one-dimensional convolutional neural networks (1D-CNN), which, using sensor data such as voltage and current, achieve accuracy rates above 99% in identifying faulty lines and fault types. These findings underscore the potential of supervised models to automate critical processes in electrical networks, a capability that can be extended to the technical classification of institutional complaints. The reliability of modern electrical networks depends on the ability to identify and classify faults across multiple system layers. Krivohlava et al. [18] conducted a systematic review of 30 fault types in smart grid infrastructures, encompassing physical, software, communication, and business components. Their SGAM-based classification provides a robust technical framework that can be adapted to institutional contexts to improve the management of electrical complaints and strengthen operational resilience. The automatic classification of electrical faults has advanced through hybrid algorithms that combine dimensionality reduction with supervised discrimination. Hosseinzadeh et al. [19] propose a model that integrate sPCA, LDA, and k-NN, improving the accuracy of fault detection and classification in smart grids. This approach demonstrates that, given load variability and the limitations of traditional models, supervised learning algorithms provide an effective and adaptable solution that is also applicable to the technical management of electrical complaints. The prediction of extreme events in electrical systems requires models that integrate both technical and operational criteria. Mohammadian et al. [20] propose a classifier based on Bayesian decision theory that not only minimizes prediction errors but also accounts for the cost of each preventive action. This approach enables resilience-oriented decision-making and can be |
|
extrapolated to the classification of institutional electrical complaints, particularly when prioritization must be based on impact and urgency. Rana [21] presents a systematic review of 180 studies demonstrating that artificial intelligence–based ap proaches, including machine learning, digital twins, and self-healing grids, outperform traditional methods in accuracy, adaptability, and operational efficiency. These findings reinforce the feasibility of applying supervised models to classify institutional electrical complaints, anticipate faults, and optimize technical response. In recent years, several enhancements to the random forest algorithm have been proposed to address limitations associated with tree correlation and reduced accuracy in certain decision-tree configurations. Sun et al. [22] developed an improved random forest that incorporates tree-selection mechanisms based on accuracy and correlation reduction, achieving superior performance over conventional implementations. Jing et al. [23] proposed a hybrid predictive-maintenance approach for electrical meters that combines LSTM and XGBoost with an improved optimization algorithm, achieving significant improvements in accuracy and operational efficiency. Hussain et al. [24] assessed multiple machine-learning algorithms, including random forest and gradient boosting, for predicting energy consumption in electric vehicles, confirming the effectiveness of ensemble methods for capturing complex patterns. Khalili et al. [25] applied CatBoost and ExtraTrees to the predictive maintenance of submersible pumps, achieving high accuracy and sensitivity in identifying critical faults. Collectively, these studies reinforce the applicability of ensemble models for prioritizing electrical complaints in institutional contexts. Multiple studies have shown that machine-learning techniques can substantially optimize operational processes in electrical distribution companies. For example, Ahmad and Chen [26] developed ML-based models, including CDT, k-NN, and LRM, for short- and mediumterm electricity-demand forecasting, achieving marked improvements in accuracy even when only incomplete climate data are available. Such contributions reinforce the relevance of applying machine-learning models to critical tasks in the electrical sector, such as the automated prioritization of complaints addressed in this study. Zhang et al. [27] conduct a comprehensive review of machine-learning techniques for detecting nontechnical losses in electrical distribution companies, showing that supervised algorithms can identify irregular consumption patterns and effectively support energy-fraud reduction. According to Ausmus et al. [28], big data analytics has become a key tool in the electrical sector, enabling the processing of large data volumes from SCADA systems and phasor measurement units (PMUs) to improve real-time operational decision-making. This approach |
facilitates the integration of machine-learning techniques to optimize the prioritization of electrical complaints and promote more efficient management of technical resources. Recent studies show that supervised decisiontree–based models enable the automatic identification of event zones in electrical systems, thereby improving outage management and asset maintenance [29]. This evidence supports the use of similar techniques for automated prioritization of electrical complaints, optimizing operational response and resource allocation. In the field of incident classification in electrical distribution systems, several studies have proposed relevant methodologies. For example, Shen et al. [30] demonstrated that integrating dimensionality reduction techniques with convolutional neural networks (CNN) significantly improves the automatic detection of disturbances in electrical systems, reinforcing the value of machine-learning-based approaches for fault analysis and diagnosis. Xu et al. [31] demonstrated that logistic regression and neural networks can be effectively applied to automatically identify fault causes in distribution systems, even under imbalanced data conditions and complex real-world scenarios. Kumwenda et al. [32] developed a classification model for low-voltage networks using synthetic and real data, demonstrating that ensemble-based methods, particularly bagged trees, achieve high accuracy in identifying system disturbances. In this context, the present work proposes and validates a supervised classification model for the automated prioritization of electrical complaints using a real dataset of 143,113 records from CNEL EP, Ecuador. The methodology includes data cleaning, the construction of derived variables capturing urgency and recurrence by zone and month, and the implementation of classifiers such as Decision Tree and Random Forest. The results show high accuracy in identifying priority complaints, demonstrating the feasibility of integrating machine-learning techniques into the operational management of the electrical sector.
2. Materials and Methods
In this study, an automated classification system for technical complaints in the Ecuadorian electrical system was developed using supervised learning algorithms. The methodology comprised six stages: collection and exploratory analysis of institutional data from CNEL EP; database preprocessing; feature engineering; dataset preparation; design and training of the classification models (Decision Tree and Random Forest); and, finally, performance evaluation using standard classification metrics. Figure 1 summarizes these stages. |
|
Figure 1. Overall methodological framework used in this study |

|
2.1.Data Collection
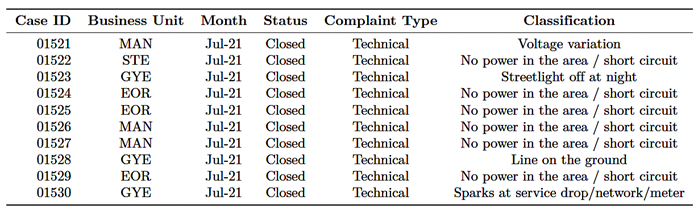
An institutional database from CNEL EP was compiled, comprising 143,113 historical records of technical complaints. Each record contains variables such as |
business unit, month, process status, complaint type, and incident classification. This dataset provides a representative collection of real cases for training supervised models. Table 1 presents the first ten records, illustrating the structure and diversity of the data. |
|
Table 1. Sample records from the CNEL EP electrical complaint database
|
|
2.2.Data Preprocessing
Data preprocessing involved removing of unnecessary spaces in text columns and correcting characterencoding issues by converting the “type of complaint” and “classification” fields from Latin1 to UTF-8. These steps ensured consistent textual values and prepared the data for subsequent analysis. In addition, null values were verified, and appropriate transformations were applied to preserve data integrity. This preprocessing ensured consistent textual values and prepared the dataset for subsequent analysis.
2.3.Feature Engineering
To enhance model predictive performance and define a classification label consistent with the operational reality of electrical complaints, the original dataset was transformed to construct the target variable Priority. This variable was defined using two analytical criteria derived from the data: urgency and recurrence by zone and month. |
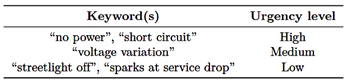
Urgency
The urgency variable classifies each complaint based on keywords identified in the “Classification” column of Table 1. This categorization distinguishes complaints with immediate user impact from those requiring less urgent attention. Table 2 presents representative examples from the CNEL EP complaint database and assigns high-, medium-, or low-urgency levels according to the severity of the reported incident.
Table 2. Urgency-level assignment for electrical complaints in CNEL EP
Recurrence by zone and month (recurrencezonemonth )
This variable represents the frequency of complaints in each business unit during a specific month. It is computed as: |
|
(recurrencezonemonth) = Number of complaints in the business unit during the month. Example: if 120 complaints were recorded in the “MAN” business unit in July, then all complaints from “MAN” in that month are assigned (recurrencezonemonth) = 120. This allows critical zones with high complaint concentration to be identified.
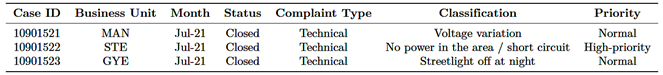
Priority (target variable)
This variable combines urgency and recurrence to classify complaints into two categories:
|
The threshold was defined as the mean recurrence plus one standard deviation across all complaints, enabling automatic identification of the most critical cases. This process yielded a representative label consistent with institutional criteria for priority attention. The resulting “Priority” variable was added to the dataset as the model’s target label, as shown in Table 3. |
|
|
(1) |
|
Table 3. Sample complaints with derived variables
|
|
2.4.Dataset Preparation
With the variables defined, the dataset was prepared for supervised learning. Categorical features such as business unit and complaint type were encoded using one-hot encoding (pd.get_dummies), transforming each category into a binary indicator column. This approach enables the classification models to process categorical information appropriately without imposing an artificial numerical order among categories. The dataset was split into training (80%) and testing (20%) subsets to ensure evaluation on unseen data and to assess model generalization. In addition, stratified cross-validation (k = 5) was applied to maintain class proportions. The value k = 5 was selected because it provides an adequate balance between metric stability and computational cost, given the dataset size. Temporal validation by month was also performed by training on earlier periods and evaluating on subsequent ones to verify the model’s robustness with respect to complaint seasonality.
2.5.Model Design and Training
To address the automated prioritization of electrical complaints, two supervised models were implemented: |
Decision tree and Random forest. Both algorithms classify complaints into two priority categories (“highpriority” or “normal”), using business unit, month, complaint type, and incident classification as input variables. In this way, the system learns to identify patterns associated with high-priority complaints by considering the incident type, its temporal context, and the operational zone in which it occurs. The Decision Tree model was selected for its interpretability, which allows supervisors to understand how input variables influence the final decision and to justify complaint prioritization. This model constructs decision rules as a hierarchy of nodes, branches, and leaves: each node represents a condition on a variable, and each leaf corresponds to the assigned class. The configuration used random_state=42 to ensure reproducibility, no depth restriction (max_depth=None) to allow the tree to capture all relationships present in the data, and the Gini impurity criterion for split evaluation. The model was trained on the training set (X_train, y_train) and evaluated on the test set (X_test). To improve robustness and generalization, a Random Forest model was implemented as an ensemble of 100 decision trees (n_estimators=100), with predictions |
|
combined through majority voting. Bootstrap= True was used to enable sampling with replacement, and the Gini index was retained as the impurity measure for each tree. This approach reduces the risk of overfitting and accommodates the variability and correlation inherent in complaint data. As with the Decision Tree model, the Random Forest was trained on (X_train, y_train) and evaluated on (X_test).
2.6.Model Evaluation and Validation
The models were assessed using standard classification metrics to evaluate their performance in predicting high-priority and normal complaints. Accuracy represents the overall proportion of correctly classified complaints. Precision indicates the share of complaints predicted as high-priority that are truly high-priority. Recall measures the proportion of high-priority complaints correctly identified among all high-priority cases in the dataset. The F1-score, defined as the harmonic mean of precision and recall, provides a balanced measure that is particularly informative when the high-priority class is less frequent. Together with the confusion matrix, these metrics enable a reliable evaluation of each model’s ability to prioritize complaints effectively. For a more detailed assessment, traditional metrics were complemented with advanced tools. The PR-AUC (precision-recall area under the curve) is particularly informative in imbalanced-class settings because it reflects the model’s ability to correctly identify priority complaints. Decision-curve analysis enables visualization of the operational benefit associated with different decision thresholds, supporting the selection of an optimal prioritization rule. Calibration analysis verifies that predicted probabilities correspond to the observed likelihood of a priority complaint. Finally, confidence intervals provide statistical robustness to the reported metrics and reduce the risk of overestimating model performance. The combination of traditional and complementary metrics ensures a comprehensive and reliable evaluation, supporting both the selection of the bestperforming model and its practical implementation in electrical complaint management.
3. Results and Discussion
This section presents the results of applying supervised classification models to institutional electrical complaints, distinguishing between the normal and high-priority categories. Model performance was assessed using standard metrics, including precision, recall, F1-score, and overall accuracy, which enabled evaluation of |
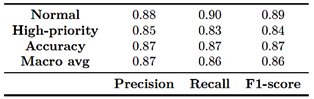
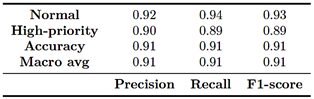
each model’s ability to correctly identify cases requiring urgent attention. The performance of the Decision Tree model is summarized in Table 4, indicating satisfactory classification of complaints. The model achieved an overall accuracy of 87%, with balanced precision, recall, and F1-score values. For the normal class, precision, recall, and F1-score were 0.88, 0.90, and 0.89, respectively. For the high-priority class, the corresponding values were 0.85, 0.83, and 0.84.
Table 4. Classification report for the Decision Tree model
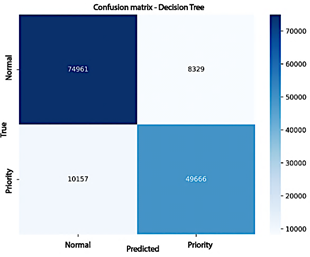
These results indicate that the model reliably identifies the most urgent complaints while maintaining an appropriate balance between correctly classifying high-priority cases and minimizing false positives. Figure 2 shows the confusion matrix for the Decision Tree model trained on the cleaned electrical complaint dataset. The model correctly classified 74,961 normal complaints and 49,666 high-priority complaints, demonstrating a solid ability to distinguish between the two categories. However, some misclassifications occurred: 8,329 normal complaints were incorrectly labeled as high-priority, while 10,157 high-priority complaints were classified as normal. These values correspond to the model’s false positives and false negatives, respectively.
Figure 2. Confusion matrix for the Decision Tree model
These results confirm solid overall performance (87% accuracy) with balanced behavior across both classes. A slight tendency to underestimate some truly high-priority complaints persists, which is expected in scenarios where the priority class is underrepresented. |
|
The Random Forest model outperformed the Decision Tree, confirming its stronger ability to capture nonlinear patterns and mitigate overfitting. Table 5 summarizes the results, showing an overall accuracy of 91% with balanced performance across both classes. The normal category achieved a precision of 0.92, a recall of 0.93, and an F1-score of 0.92, while the highpriority category recorded a precision of 0.90, a recall of 0.89, and an F1-score of 0.89.
Table 5. Classification report for the Random Forest model
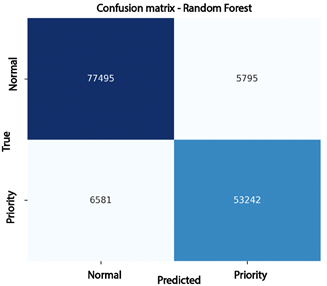
These results show that the model achieves a better balance between sensitivity and precision, reducing the classification errors observed in the Decision Tree. In practical terms, the Random Forest improves the identification of high-priority complaints while maintaining a low false-positive rate, making it a more reliable tool for supportingoperational prioritization. Figure 3 shows the confusion matrix for the Random Forest model. This model exhibits more balanced and accurate performance, correctly classifyin g77,495 normal complaints and 53,242 high-priority complaints. Classification errors were relatively small: 5,795 normal complaints were incorrectly identified as highpriority, while 6,581 high-priority complaints were classified as normal. This behavior confirms the model’s
|
consistency and strong generalization capability, as it substantially reduces critical errors compared to the Decision Tree. Consequently, the Random Forest emerges as one of the most reliable alternatives for automated prioritization of electrical complaints.
Figure 3. Confusion matrix for the Random Forest model
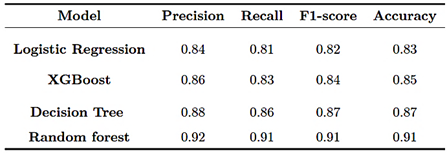
To broaden the comparison and validate the robustness of the results, two additional benchmark models, Logistic Regression and XGBoost, were trained using the same dataset and validation scheme. The results are summarized in Table 6, showing that Random Forest consistently achieved the best performance, followed by the Decision Tree. XGBoost and Logistic Regression produced acceptable results, but with lower recall in detecting priority complaints. |
|
Table 6. Comparison of performance metrics across supervised models
|
|
The Random Forest model achieved 91% accuracy and an average F1-score of 0.91, making it the most robust and stable alternative. The Decision Tree showed slightly lower performance, with 87% accuracy and an F1-score of 0.87, while still providing solid classification capability but with greater variability between classes. XGBoost achieved 85% accuracy and an F1- score of 0.84, exhibiting a mild tendency toward overfitting in the minority class. Finally, Logistic Regression, although |
simpler, delivered reasonable performance, achieving 83% accuracy and an F1-score of 0.82, confirming its value as a baseline but revealing limitations in capturing nonlinear relationships among variables. These results confirm that ensemble-based models, particularly Random Forest, achieve stronger generalization by reducing errors in identifying high-priority complaints. By contrast, individual or linear models exhibit lower performance when confronted with complex or nonlinear patterns such as those present in institutional electrical claims. |
|
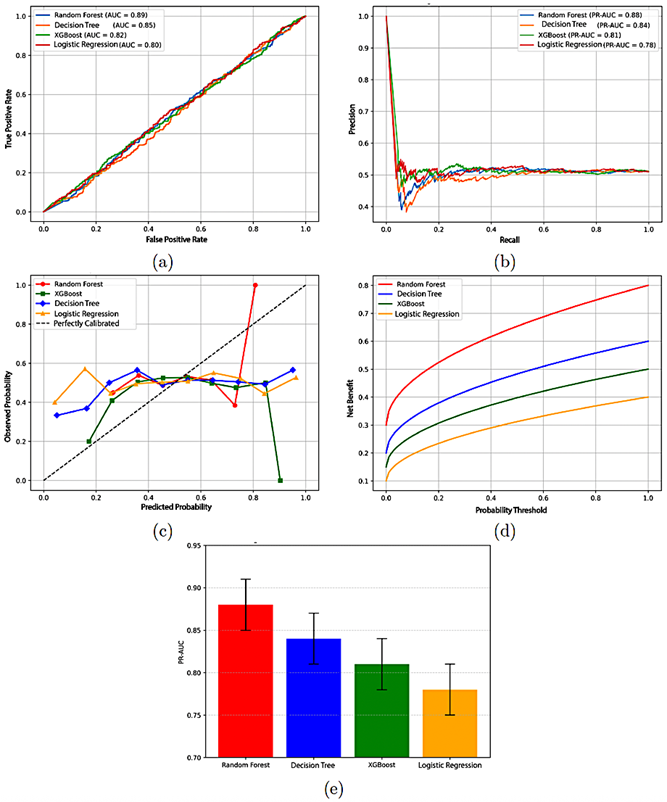
To evaluate the discriminative capacity of the classification models in greater detail, receiver operating characteristic (ROC) and precision–recall (PR) curves were generated for the four analyzed algorithms: Decision tree, Random forest, Logistic Regression, and XGBoost. Figure 4a shows that the Random Forest model achieved the highest AUC (0.89), followed by the Decision Tree (0.85), XGBoost (0.82), and Logistic Regression (0.80). These values indicate that Random Forest has the strongest ability to discriminate between high-priority and normal complaints. Figure 4b shows the precision–recall curves, which are particularly relevant given the dataset’s class imbalance. Random Forest again stands out achieving a PR-AUC of 0.88, while the Decision Tree, XGBoost, and Logistic Regression reached 0.84, 0.81, and 0.78, respectively. This result confirms that Random Forest maintains higher precision and recall even when the prevalence of the positive class is low.
|
Regarding the reliability of predicted probabilities, the calibration plot in Figure 4c shows that Random Forest and XGBoost align more closely with the ideal diagonal, indicating probability estimates that are more consistent with observed frequencies. In contrast, the Decision Tree and Logistic Regression exhibit slight deviations, suggesting poorer calibration at certain thresholds. The decision-curve analysis in Figure 4d confirms that Random Forest provides the highest net benefit across a wide range of thresholds, making it the most advantageous model for automated prioritization of electrical complaints from an operational standpoint. This type of curve is included because it evaluates performance while accounting for the real costs and benefits associated with each decision. Unlike purely statistical metrics, decision-curve analysis quantifies the model’s practical utility by incorporating the consequences of correct and incorrect classifications. This is essential in operational settings, where misclassification may lead to service delays or inefficient resource use. |
|
Figure 4. a) ROC curves of the classification models. b) Precision–recall curves for the models. c) Calibration curves for the models. d) Decision-curve analysis. e) 95% confidence intervals for PR-AUC |
|
Additionally, 95% confidence intervals for the PRAUC were estimated using bootstrap resampling (1000 iterations). Random Forest showed a narrow, high interval (0.85–0.91), followed by the Decision Tree (0.81–0.87), XGBoost (0.78–0.84), and Logistic Regression (0.75–0.81). Confidence intervals quantify performance variability and assess each model’s stability under potential dataset fluctuations. Whereas a single PR-AUC value reflects average performance, the intervals indicate how consistently a model performs under perturbations, which is essential when selecting reliable methods for real-world deployment. Figure 4e summarizes these intervals, highlighting the superior statistical stability of Random Forest. Taken together, Figures 4a–4e show that Random Forest provides the best overall performance, combining strong discrimination, good calibration, high operational benefit, and robust statistical stability. The Decision Tree remains an acceptable lower complexity alternative, whereas XGBoost and Logistic Regression show competitive performance but weaker generalization in this context. Unlike previous studies such as Hosseinzadeh et al. (2021), which validated their fault prediction model using simulated data, and Alhanaf et al. (2021), which relied on smaller-scale experimental samples, the present work is distinguished by the use of a real institutional database from CNEL EP. This dataset comprises more than 143,000 electrical complaints recorded in the province of Santo Domingo. Using real operational records provides a level of realism and immediate applicability that is not always present in international research, as it directly reflects the nature of the complaints submitted by users to the electric utility company. Furthermore, the methodological approach proposed here is not limited to evaluating a single algorithm; instead, it systematically compares the performance of Decision Tree and Random Forest models using precision, recall, F1-score, and AUC-ROC metrics, thereby strengthening the validity of the results. Accordingly, the primary contribution of this study is to demonstrate how machine-learning techniques can be practically integrated into the complaintmanagement processes of an electricity distribution company in Ecuador. This work overcomes the limitations of studies that rely solely on synthetic data or controlled settings and provides findings that are directly applicable to daily operations. The results show that the Random Forest model consistently outperforms the Decision Tree in automated prioritization of electrical complaints, achieving an overall accuracy of 91% and an AUC-ROC of 0.89, compared with 87% accuracy and an AUC-ROC of 0.85 for the Decision Tree. This improvement indicates a |
stronger ability to discriminate between high-priority and normal cases [1], consistent with the robustness and generalization capacity that characterize ensemble models [22], [24, 25]. While Hussain et al. [24] applied ensemble models to energy prediction in electric vehicles, the present work uses Random Forest to prioritize electrical complaints at CNEL EP, demonstrating that comparable robustness and generalization capacity can enhance operational management and resource allocation in institutional settings. Similarly, Jing et al. [23] focused on predicting and optimizing electric meter maintenance through a hybrid LSTM-XGBoost approach. By contrast, this study applies Random Forest to the prioritization of institutional electrical complaints, incorporating derived variables such as urgency and recurrence by zone and month. These results illustrate how supervised approaches can optimize resource allocation and improve service delivery to end users within CNEL EP. Unlike the study by Sun et al. [22], which focused on improving the internal architecture of Random Forest to reduce correlation and increase accuracy, the present work emphasizes the practical integration of the model into the institutional management of electrical complaints. Incorporating derived variables enables more effective operational prioritization, thereby complementing methodological advances in algorithm refinement with a concrete application to the Ecuadorian electricity sector. The analysis of the confusion matrices indicates that Random Forest substantially reduces critical errors by minimizing the misclassification of high-priority complaints as normal. This improvement has direct operational implications, enabling shorter response times, more efficient scheduling of technical crews, and enhanced user perception of service quality [1], [7]. Taken together, these findings validate the applicability of ensemble models for prioritizing electrical complaints in real institutional settings and support their integration into operational management processes. From a comprehensive perspective, analyses based on confusion matrices, ROC and precision–recall curves, calibration plots, decision-curve analysis, and confidence intervals indicate that the superior performance of Random Forest is consistent and not driven by model-specific adjustments. This combination of strong discrimination, statistical stability, and operational utility is critical for managing electrical complaints, where misclassifications can cause service delays, inefficient crew allocation, and reduced perceived service quality. Accordingly, Random Forest emerges as the most suitable model for automated prioritization at CNEL EP, offering a robust balance between technical performance and operational relevance. |
|
Although XGBoost and Logistic Regression exhibit acceptable performance, limitations in calibration and stability constrain their direct applicability. The Decision Tree, despite its simplicity and interpretability, also shows reduced effectiveness under high variability and class-imbalance conditions. Taken together, these findings confirm that ensemble approaches such as Random Forest provide a robust and reliable alternative for optimizing electrical complaint management in the Ecuadorian electricity sector.
4. Conclusiones
This study demonstrates the viability and effectiveness of applying supervised learning models for the automated prioritization of electrical complaints within the institutional context of CNEL EP. The results show that both Decision Tree and Random Forest can accurately classify complaints by priority level. However, Random Forest achieved superior performance, reaching 91% overall accuracy and an AUC-ROC of 0.89. This superiority is reflected in reduced critical errors and stronger discrimination between high-priority and normal complaints, which is essential for improving operational efficiency and enhancing user satisfaction. Incorporating derived variables such as urgency, recurrence by zone and month, along with careful preprocessing and categorical-variable encoding, enhanced the models’ predictive capacity and ensured robust performance under the variability of real-world data. Complementary analyses using confusion matrices, ROC and precision–recall curves, calibration plots, and decision-curve analysis confirmed that the superior performance of Random Forest is consistent and not driven by model-specific adjustments, demonstrating its statistical stability and operational utility. From an operational perspective, implementing this system provides a reliable and scalable tool for intelligent allocation of technical resources and improved customer service, contributing to more efficient and proactive management of electrical services. As future work, it is recommended to expand the dataset by incorporating additional contextual variables such as weather conditions, incidence by user type, and infrastructure-related events. It is also advisable to explore more advanced or hybrid machine-learning algorithms and to evaluate real-time deployment to further enhance operational efficiency. These actions will consolidate the model’s applicability, strengthen institutional decision-making, and broaden its impact on optimizing electrical service management in Ecuador. |
For operational integration at CNEL EP, the model can be embedded in an interactive control dashboard that receives complaints in real time, automatically preprocesses the data, and classifies each case as normal or high-priority using the Random Forest model. The outputs would be displayed on a dashboard accessible to supervisors, enabling more efficient assignment of technical crews and real-time monitoring of performance indicators. This workflow ensures that critical complaints are addressed promptly, optimizing both human-resource utilization and response times.
Contributor Role
· Francisco Javier Carpio Velasco: conceptualization, methodology, formal analysis, software, visualization, writing – original draft and validation. · Gloria Margarita Garcés Beltrán: supervision, formal analysis and writing – review & editing.
References
[1] R. Walters, E. J. Jaselskis, and J. M. Kurtenbach, “Classification of Knowledge within the Electrical Contracting Industry: A Case Study,” Leadership and Management in Engineering, vol. 7, no. 1, pp. 11–17, 2007. [Online]. Available: https://doi.org/10.1061/(ASCE)1532-6748(2007)7:1(11) [2] P. Gaiardelli, B. Resta, V. Martinez, R. Pinto, and P. Albores, “A classification model for product-service offerings,” Journal of Cleaner Production, vol. 66, pp. 507–519, Mar. 2014. [Online]. Available: https://doi.org/10.1016/j.jclepro.2013.11.032 [3] G. Chicco, R. Napoli, F. Piglione, P. Postolache, M. Scutariu, and C. Toader, “Emergent electricity customer classification,” IEE Proceedings - Generation, Transmission and Distribution, vol. 152, no. 2, p. 164, 2005. [Online]. Available: https://doi.org/10.1049/ip-gtd:20041243 [4] ——, “Load Pattern-Based Classification of Electricity Customers,” IEEE Transactions on Power Systems, vol. 19, no. 2, pp. 1232–1239, May 2004. [Online]. Available: https://doi.org/10.1109/TPWRS.2004.826810 [5] G. Wacker and R. Billinton, “Customer cost of electric service interruptions,” Proceedings of the IEEE, vol. 77, no. 6, pp. 919–930, Jun. 1989. [Online]. Available: https://doi.org/10.1109/5.29332 |
|
[6] C. Beckel, L. Sadamori, and S. Santini, “Towards automatic classification of private households using electricity consumption data,” in Proceedings of the Fourth ACM Workshop on Embedded Sensing Systems for Energy- Efficiency in Buildings, ser. SenSys ’12. ACM, Nov. 2012, pp. 169–176. [Online]. Available: https://doi.org/10.1145/2422531.2422562 [7] H. M. Ahmed, “The effect of customer complaint handling practices on customer satisfaction in ethiopian electric utility customer service center,” International Journal of Management (IJM), vol. 15, no. 1, 2024. [Online]. Available: https://upsalesiana.ec/ing35ar6r7 [8] G. F. Calderon Intriago, J. C. Mera Macías, and J. C. Guamán Segarra, “El mercado elÉctrico ecuatoriano y su incidencia en los altos costos de las tarifas de energÍa elÉctrica a los consumidores residenciales y comerciales en la provincia de manabí comprendidos en el periodo de enero a diciembre del 2018.” Revista de Investigaciones en Energía, Medio Ambiente y Tecnología: RIEMAT, vol. 3, no. 2, p. 24, Dec. 2018. [Online]. Available: https://doi.org/10.33936/riemat.v3i2.1627 [9] A. K. Montesdeoca Rivas and M. Cedillo Fajardo, “Análisis de la calidad de servicio y la satisfacción del usuario externo en la empresa eléctrica pública estratégica corporación nacional de electricidad cnel ep, guayaquil–2020.” Ciencia Latina Revista Científica Multidisciplinar, vol. 7, no. 3, pp. 9840–9858, Jul. 2023. [Online]. Available: https://doi.org/10.37811/cl_rcm.v7i3.7009 [10] C. A. Vásconez-Mejía, J. F. Molina-Mora, and M. E. Gaspar-Santos, “Derechos de los consumidores del servicio eléctrico en tiempos de pandemia en Ecuador,” CIENCIAMATRIA, vol. 8, no. 2, pp. 80–91, Mar. 2022. [Online]. Available: https://doi.org/10.35381/cm.v8i2.698 [11] M. Neira and R. Quintanilla, “La calidad del servicio técnico de electricidad,” Revista Técnica “Energía”, vol. 8, no. 1, Jan. 2012. [Online]. Available: https://doi.org/10.37116/revistaenergia.v8.n1.2012.189 [12] C. C. Orozco Domínguez, A. F. Sánchez Hernández, and M. J. Santiago Camacho, “Deficiencias en la prestación del servicio de energía eléctrica en la ciudad deCartagena,” Vis Iuris, pp. 55–74, Nov. 2017. [Online]. Available: https://doi.org/10.22518/vis.v0i00.1174
|
[13] G. E. Chodzaza and H. S. Gombachika, “Service quality, customer satisfaction and loyalty among industrial customers of a public electricity utility in malawi,” International Journal of Energy Sector Management, vol. 7, no. 2, pp. 269–282, Jun. 2013. [Online]. Available: https://doi.org/10.1108/IJESM-02-2013-0003 [14] S. Abideen, O. Joseph, J. Surajudeen, and A. Adeyinka, “Service quality and customer satisfaction of electricity distribution company: A study of olumo business hub, abeokuta, ogunstate,” SSRN Electronic Journal, 2018. [Online]. Available: https://doi.org/10.2139/ssrn.3391404 [15] W. Li, W. W. K. Pomegbe, C. S. K. Dogbe, and J. D. Novixoxo, “Employees’ customer orientation and customer satisfaction in the public utility sector: The mediating role of service quality,” African Journal of Economic and Management Studies, vol. 10, no. 4, pp. 408–423, Dec. 2019. [Online]. Available: https://doi.org/10.1108/AJEMS-10-2018-0314 [16] D. Sarathkumar, M. Srinivasan, A. A. Stonier, R. Samikannu, N. R. Dasari, and R. A. Raj, “A technical review on classification of various faults in smart grid systems,” IOP Conference Series: Materials Science and Engineering, vol. 1055, no. 1, p. 012152, Feb. 2021. [Online]. Available: https://doi.org/10.1088/1757-899X/1055/1/012152 [17] A. S. Alhanaf, H. H. Balik, and M. Farsadi, “Intelligent fault detection and classification schemes for smart grids based on deep neural networks,” Energies, vol. 16, no. 22, p. 7680, Nov. 2023. [Online]. Available: https://doi.org/10.3390/en16227680 [18] Z. Krivohlava, S. Chren, and B. Rossi, “Failure and fault classification for smart grids,” Energy Informatics, vol. 5, no. 1, Oct. 2022. [Online]. Available: https://doi.org/10.1186/s42162-022-00218-3 [19] J. Hosseinzadeh, F. Masoodzadeh, and E. Roshandel, “Fault detection and classification in smart grids using augmented knn algorithm,” SN Applied Sciences, vol. 1, no. 12, Nov. 2019. [Online]. Available: https://doi.org/10.1007/s42452-019-1672-0 [20] M. Mohammadian, F. Aminifar, N. Amjady, and M. Shahidehpour, “Data-driven classifier for extreme outage prediction based on bayes decision theory,” IEEE Transactions on Power Systems, vol. 36, no. 6, pp. 4906–4914, Nov. 2021. [Online]. Available: https://doi.org/10.1109/TPWRS.2021.3086031 |
|
[21] S. Rana, “Ai-driven fault detection and predictive maintenance in electrical power systems: A systematic review of data-driven approaches, digital twins, and self-healing grids,” American Journal of Advanced Technology and Engineering Solutions, vol. 1, no. 01, pp. 258–289, Feb. 2025. [Online]. Available: https://doi.org/10.63125/4p25x993 [22] Z. Sun, G. Wang, P. Li, H. Wang, M. Zhang, and X. Liang, “An improved random forest based on the classification accuracy and correlation measurement of decision trees,” Expert Systems with Applications, vol. 237, p. 121549, Mar. 2024. [Online]. Available: https://doi.org/10.1016/j.eswa.2023.121549 [23] H. Jing, H. Cao, and S. Sun, “Multiobjective predictive maintenance optimization of electric energy meters based on lstm-xgboost and modified firefly algorithm,” International Journal of Emerging Electric Power Systems, Aug. 2025. [Online]. Available: https://doi.org/10.1515/ijeeps-2025-0184 [24] I. Hussain, K. B. Ching, C. Uttraphan, K. G. Tay, and A. Noor, “Evaluating machine learning algorithms for energy consumption prediction in electric vehicles: A comparative study,” Scientific Reports, vol. 15, no. 1, May 2025. [Online]. Available: https://doi.org/10.1038/s41598-025-94946-7 [25] Y. Khalili, M. Ahmadi, and M. K. Moraveji, “Time-aware predictive maintenance of electrical submersible pumps using catboost ensemble learning and trend-based labeling,” Journal of Petroleum Exploration and Production Technology, vol. 15, no. 9, Aug. 2025. [Online]. Available: https://doi.org/10.1007/s13202-025-02070-z [26] T. Ahmad, H. Chen, R. Huang, G. Yabin, J. Wang, J. Shair, H. M. Azeem Akram, S. A. Hassnain Mohsan, and M. Kazim, “Supervised based machine learning models for short, medium and long-term energy prediction in distinct building environment,” Energy, vol. 158, pp. 17–32, Sep. 2018. [Online]. Available: https://doi.org/10.1016/j.energy.2018.05.169 |
[27] T. Zhang, R. Gao, and S. Sun, “Theories, applications and trends of non-technical losses in power utilities using machine learning,” in 2018 2nd IEEE Advanced Information Management,Communicates,Electronic and Automation Control Conference (IMCEC). IEEE, May 2018, pp. 2324–2329. [Online]. Available: https://doi.org/10.1109/imcec.2018.8469410 [28] J. Ausmus, R. S. de Carvalho, A. Chen, Y. N. Velaga, and Y. Zhang, “Big data analytics and the electric utility industry,” in 2019 International Conference on Smart Grid Synchronized Measurements and Analytics (SGSMA). IEEE, May 2019. [Online]. Available: https://doi.org/10.1109/SGSMA.2019.8784657 [29] M. J. Mousavi, J. Stoupis, and K. Saarinen, “Event zone identification in electric utility systems using statistical machine learning,” in 2018 IEEE/PES Transmission and Distribution Conference and Exposition (T&D). IEEE, Apr. 2018, pp. 1–9. [Online]. Available: https://doi.org/10.1109/TDC.2018.8440570 [30] Y. Shen, M. Abubakar, H. Liu, and F. Hussain, “Power quality disturbance monitoring and classification based on improved pca and convolution neural network for windgrid distribution systems,” Energies, vol. 12, no. 7, p. 1280, Apr. 2019. [Online]. Available: https://doi.org/10.3390/en12071280 [31] L. Xu and M.-Y. Chow, “A classification approach for power distribution systems fault cause identification,” IEEE Transactions on Power Systems, vol. 21, no. 1, pp. 53–60, Feb. 2006. [Online]. Available: https://doi.org/10.1109/TPWRS.2005.861981 [32] B. Kumwenda, E. Zulu, and M. Ndiaye, “System disturbance classification model for a low voltage distribution network,” in 2024 IEEE PES/IAS PowerAfrica. IEEE, Oct. 2024, pp. 01–05. [Online]. Available: https://doi.org/10.1109/PowerAfrica61624.2024.10759455 |