|
Scientific Paper / Artículo Científico |
|
|
|
|
https://doi.org/10.17163/ings.n35.2026.10 |
|
|
|
pISSN: 1390-650X / eISSN: 1390-860X |
|
|
SWIN TRANSFORMER V2 FOR THE CLASSIFICATION OF LOJA COFFEE |
||
|
SWIN TRANSFORMER V2 PARA CLASIFICACIÓN DE CAFÉ LOJANO |
||
|
Patricio Bolívar
Betancourt Ludeña1 |
|
Received: 11-07-2025, Received after review: 01-12-2025, Accepted: 09-12-2025, Published: 01-01-2026 |
|
Abstract |
Resumen |
|
This study presents a binary classification model for green coffee beans of the Arabica variety from the Loja region in Ecuador, based on the Swin Transformer V2 architecture. Two datasets were used, the public USK-COFFEE dataset of Indonesian origin and a proprietary dataset captured under controlled conditions. Two training strategies were evaluated: sequential transfer learning and unified training, with the latter achieving a validation accuracy of 98.30%. After hyperparameter optimization, the model reached 100% accuracy on a test set of 150 images and 93% accuracy on an external generalization set of 400 images with varying lighting conditions and backgrounds. Model interpretability was validated using Grad-CAM, demonstrating that the network focuses on actual defective regions rather than background information. An ablation analysis revealed that performance degradation in unconstrained scenarios is mainly due to sensitivity to noise and extreme lighting conditions. The main contributions of this work include the creation of a specialized dataset for Arabica green coffee from Loja and the development of an efficient model for its automatic classification. |
Esta investigación presenta un modelo de clasificación binaria para granos de café verde de la variedad arábico procedentes de la región de Loja, Ecuador, basado en la arquitectura Swin Transformer V2. Se emplearon dos fuentes de datos, el conjunto de datos público USK-Coffee, de origen indonesio, y un conjunto de datos propio capturado bajo condiciones controladas. Se evaluaron dos estrategias de entrenamiento: transferencia secuencial y entrenamiento unificado, siendo este último el que alcanzó una precisión de validación del 98,30 %. Tras la optimización de hiperparámetros, el modelo logró una precisión del 100 % en un conjunto de prueba de 150 imágenes y del 93 % en un conjunto de generalización externo de 400 imágenes con condiciones variables de iluminación y fondo. La interpretabilidad del modelo se validó mediante Grad-CAM, evidenciando que la red enfoca su atención en zonas defectuosas reales. Un análisis de ablación mostró que la disminución de rendimiento en escenarios no controlados se debe principalmente a la sensibilidad al ruido y a la iluminación extrema. Como principales aportes, se destaca la creación de un conjunto de datos especializado y un modelo eficiente para la clasificación automática de café verde arábico. |
|
Keywords: coffee classification, artificial intelligence, Vision Transformer, Swin Transformer, computer vision, transfer learning |
Palabras clave: clasificación de café, inteligencia artificial, Vision Transformer, Swin Transformer, visión por computadora, aprendizaje por transferencia |
|
1,*Carrera de Ingeniería en Computación, Universidad
Nacional de Loja, Ecuador. Corresponding author ✉: oscar.cumbicus@unl.edu.ec.
Suggested citation: P. T. Betancourt Ludeña and O.M. Cumbicus Pineda, “Swin transformer v2 for the classification of loja coffee,” Ingenius, Revista de Ciencia y Tecnología, N.◦ 35, pp. 128-137, 2026, doi: https://doi.org/10.17163/ings.n35.2026.10. |
|
1. Introduction
The coffee production sector, specifically in the production of Arabica green coffee, is experiencing continuous growth [1]. Similarly, in the Loja region of Ecuador, the expansion of this sector has been evident [2]. However, it faces significant challenges in terms of the accurate classification of coffee beans, a process that is essential to ensure the quality of the final product and maintain its competitiveness in the international market [3]. Traditionally, this process has been carried out manually, which has resulted in variability in outcomes due to human intervention and fatigue from repetitive work [4]. In this context, technologies that have emerged in recent years, based on artificial intelligence (AI), specifically computer vision models, have offered an innovative and accurate solution for automating the task of coffee bean classification [5, 6]. To date, convolutional neural networks (CNNs) have stood out by demonstrating very favorable results in classification tasks [7,8], [5]. On the other hand, Vision Transformer (ViT) models, and more recently the Swin Transformer, have demonstrated superiority in generalizing certain local and global features of complex images [9, 10]. At present, a variety of models are proposed as solutions to this problem, such as in [11], where an accuracy of 99.84% was achieved in the detection of defects in Arabica green coffee beans. In the work presented in [12], multispectral images and SVM (Support Vector Machine) were used to classify between specialty and commercial classes of coffee beans, achieving 96% accuracy. Likewise, in [13], a multiclass classification approach was used, and an accuracy of 84.75% was reported with its Swin Transformer model when using the USK-Coffee dataset. These studies illustrate the capability of computer vision technologies to overcome human limitations in coffee bean classification. Similarly, an important limitation for model development at the local level is the absence of a dataset specific to the Loja region, which restricts the ability of the models to generalize and learn the specific characteristics of locally produced Loja coffee. Recently, computer vision models based on Transformers have demonstrated great potential [14, 15]. Vision Transformers process images in patches, applying global and local attention to their details. In comparative works such as [16], where ViT and CNN models were compared on retinal images, it was shown that the Swin Transformer model achieved higher performance than convolutional neural networks, with an accuracy of 97.3%. Additionally, the Swin Transformer V2 model developed by Liu et al. [17] scaled its architecture to 3 billion parameters and set performance records by increasing the model’s capacity and resolution. This advancement in the model version suggests a greater |
capability for discriminating more complex visual patterns, which is necessary for the detection of small defects in coffee beans. The present work proposes the design and evaluation of a binary classification model for Arabica green coffee beans from the Loja region, Ecuador. Consequently, for the development of this study, public datasets of coffee images were used, complemented with a set of images taken from coffee beans from the Loja region, obtained through image acquisition under controlled conditions. The model was trained and validated using the previously described datasets and evaluated with the Loja dataset. This study assessed the performance of the Swin Transformer V2 model, pretrained on ImageNet-1K, through the application of Transfer Learning and Fine-Tuning techniques. On the other hand, this research contributes to the state of the art by providing a new dataset of Arabica green coffee from the province of Loja.
2. Materials and methods
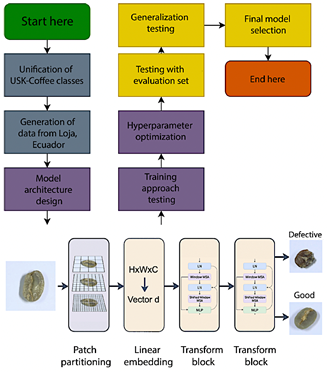
In this section, the datasets used, the architecture of the implemented Swin Transformer V2 model, the training strategy, and the evaluation metrics employed for the classification of Arabica green coffee beans are described. All of the above is summarized into three phases covered by the CRISP-ML(Q) methodology [18], namely data engineering, model engineering, and model evaluation (Figure 1).
2.1.Datasets Used
For the development and evaluation of the model, two main datasets were used, related to the classification of green coffee beans (hulled and not subjected to roasting) of the Arabica variety. The selected datasets for this research are presented below. USK-COFFEE: A public dataset containing 8,000 images of Arabica green coffee beans, originally distributed into four classes (peaberry, longberry, premium, defect) [19]. For this study, the original dataset was modified by consolidating three of its classes (peaberry, longberry, and premium) into a category referred to as “good,” while the defect class was maintained as “defective,” thus forming a binary classification. Specifically, data augmentation techniques were applied to the “defective” class, including random rotations, horizontal/vertical flips, and brightness/contrast adjustments, in order to balance the classes while maintaining a certain degree of data variability and to avoid overfitting during training. |
|
Figure 1. Materials and methods diagram. The workflow shows: coffee bean image input (H×W×C), patch partitioning, linear embedding, sequential Transformer blocks, and final binary classification (Good/Defective). |
|
Loja Dataset: A proprietary dataset was constructed from Arabica green coffee beans collected in the Gonzanamá area, province of Loja, Ecuador. For data collection, five pounds of coffee were randomly selected, which were then hulled and milled. Subsequently, a local coffee grower performed manual classification, separating the beans into two categories: good and defective. In order to capture the images under controlled conditions, the beans were arranged on an A4 sheet of white bond paper placed on top of a white A3 cardboard sheet. Each photograph included 50 beans arranged in 5 columns and 10 rows, with separations of 5 cm and 3 cm, respectively. Illumination was ensured by two white LED lamps positioned at a height of 22 cm and a white RGB LED strip placed around the sheet. The images were captured using a Canon EOS R50 camera equipped with a 20 mm lens, positioned 28 cm above the surface. The capture parameters were set as follows: shutter speed of 1/5 s, aperture F22, ISO sensitivity 100, and remote shutter release with a 2-second timer. Each photograph was recorded in JPG and RAW formats, with a resolution of 6000 × 4000 px (24 MP). In total, 10 photographs of 50 beans each were captured, which were subsequently processed using a Python script to crop individual images of 256 × 256 px |
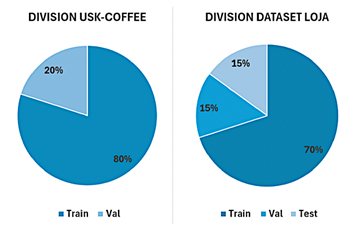
in RGB format, maintaining a white background. The final result was a balanced dataset of 1,000 images (500 per class), which constitutes the Loja dataset. Both datasets were randomly divided into training, validation, and test subsets. For the modified USKCOFFEE dataset, a proportion of 80% was used for training and 20% for validation. For the Loja dataset, the split was 70% for training, 15% for validation, and 15% for testing (Figure 2).
Figure 2. Percentage split of the USK-COFFEE and Loja datasets. |
|
To promote reproducibility and collaboration within the scientific community, the Loja dataset has been made publicly available in the Zenodo repository under a CC BY-NC 4.0 license (Creative Commons Attribution No Derivatives 4.0 International), allowing its use for non-profit research purposes. The dataset can be accessed through its DOI [20].
2.2.Swin Transformer V2 Model
The selected deep learning model was a Swin Transformer V2. This architecture was chosen for its ability to extract both local and global features from images, thanks to its hierarchical design with shifted window self-attention mechanisms that allow capturing patterns at different scales. Three pretrained variants of the Swin Transformer V2 (referred to as Base, Large, and Giant) were explored, which originate from prior training on the ImageNet-1K dataset [17]. The selected variant served as the starting point for fine-tuning on the specific task of classifying Loja coffee beans, offering different model capacities to be compared in the experiments. In general, the use of pretrained weights leveraged the knowledge acquired from general image classification, which accelerated training convergence in the new domain. The choiceof this architecture was motivated by the particularities of Transformers in computer vision, highlighting their ability to capture global dependencies in the image through attention mechanisms, in contrast to traditional CNNs focused on local regions.
2.3.Training Methods
Two model training methods were evaluated using the selected data. The first method corresponded to a sequential application of transfer learning, in which the model was adjusted in two stages. In the first stage, initial fine-tuning was performed using only the USK-COFFEE dataset, and subsequently, a second fine-tuning stage was carried out using local images of Loja coffee, generalizing the features of the larger dataset before specializing in the characteristics of the smaller dataset. The second method consisted of joint training, combining both datasets from the beginning in a single training phase. In this method, images from USK-COFFEE and Loja were mixed during the learning process, so that the model learned simultaneously from both datasets. These two approaches made it possible to compare the results of training the model with the global dataset in a sequential manner and integrating it in a unified way during model optimization. |
2.4.Experimental Configuration
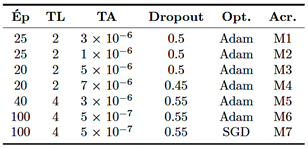
The experiments were conducted using computing resources with GPU support to accelerate training. Specifically, a local workstation (Visual Studio Code environment) equipped with a GPU with 8 GB of VRAM was used, as well as an institutional server with JupyterHub providing graphical computing capacity with 4 GPUs of 12 GB of VRAM each (48 GB of total VRAM). Regarding the optimization of training hyperparameters, seven models were generated by testing different values of learning rate, batch size, and dropout (Table 1). The number of training epochs was predefined based on preliminary experiments [18], providing sufficient iterations for model convergence without leading to overfitting.
Table 1. Values applied in the manual hyperparameter optimization. Ép: Epochs, TL: Batch size, TA: Learning rate, Opt.: Optimizer, Acr.: Model acronym.
In terms of computational complexity, training the final model (configuration M4, see Table 1) required approximately one hour using the institutional server. This relatively short training time, given the size of the combined dataset, demonstrates the efficiency of the transfer learning approach. For practical implementation in a production environment, such as a coffee processing plant, a workstation with a dedicated midrange or high-end GPU would be required to ensure real-time classification. Although this implies an initial investment in hardware, the cost is competitive compared to specialized optical sorting equipment, offering a scalable and software-adaptable solution.
3. Results and Discussion
3.1.Data Engineering
Se consolidaron los conjuntos de datos necesarios y se Techniques were applied to improve data quality. Initially, the USK-Coffee dataset was selected as the base due to its large size (8,000 images of Arabica green coffee). Since the task was formulated as a binary classification of “good” and “defective” beans, the |
|
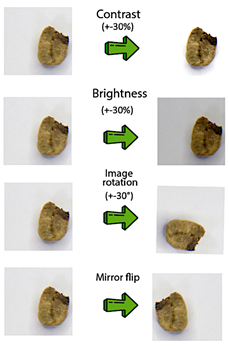
original classes (peaberry, longberry, and premium) were unified into a single category called “good,” while the “defect” class was renamed as “defective” (as described in Section 2.1). This modified dataset resulted in a class imbalance of 3,000 images of good beans versus 2,000 images of defective beans. To correct the class imbalance, oversampling with transformations (Figure 3) was performed on the defective class until obtaining 3,000 images per class. Additionally, a dataset of Arabica green coffee collected and classified by producers from Loja was constructed. A total of 500 images per class (“good” and “defective”) were captured, providing a local context with the intrinsic characteristics of coffee from the region, complementing the Indonesia dataset. The Indonesia and Loja datasets were randomly split for model training and validation, and 15% of the Loja dataset was reserved for testing the model’s performance, as described in Section 2.1.
Figure 3. Transformations for oversampling the minority “defective” class.
3.2.Model Engineering
The pretrained Swin Transformer V2 architecture was selected and fine-tuned for the specific task of Arabica green coffee bean classification. Among the available variants, the Swin V2 Large model was chosen because it offers an adequate balance between performance and complexity: it reports a Top-1 Accuracy of 87.7% on ImageNet [17] with a moderate parameter size, avoiding the computational overhead of the Giant version (90.2% Top-1 but significantly heavier). |
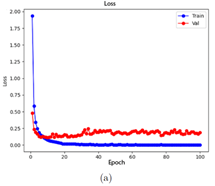
Two model training methods were explored to take advantage of the available data. In Method 1, the model was first trained using the USK-COFFEE (Indonesia) dataset, and then additional transfer learning was performed with the Loja dataset, aiming for the model to specialize in regional characteristics during a second phase. In Method 2, by contrast, both datasets were combined from the beginning into a single unified training process. After testing both approaches, it was observed that the unified dataset method achieved higher validation accuracy (98.30%) than the separated phased method (97.33%). Therefore, for subsequent stages, the model was trained using the combined data, suggesting that jointly exposing the model to the complete dataset enabled better initial generalization. Additionally, a manual hyperparameter optimization was carried out, iteratively adjusting the values to maximize validation accuracy in order to refine the model’s performance. Seven different configurations were tested (models M1–M7), varying key parameters such as number of epochs, batch size, learning rate, dropout, and optimizer. Each model was trained under the unified data strategy. In general, all models converged to high validation accuracies without drastic differences among most configurations. This result indicates that the choice of hyperparameters within reasonable ranges did not radically affect performance, due to the richness of the dataset and the robustness of the pretrained model. Nevertheless, to proceed with a more detailed evaluation, the four best-performing models (M1, M4, M5, and M6) were selected, with M6 showing the best performance during training and validation with an overall accuracy of 98.22% (Figure 4); additionally, those models with lower performance were discarded (Table 2).
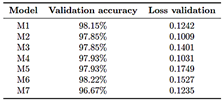
Table 2. Validation accuracy and loss values for each model in the hyperparameter optimization.
|
|
Figure 4. Training and validation progress of model M6. (a) Loss curve, (b) Accuracy curve.
3.3.Model Evaluation
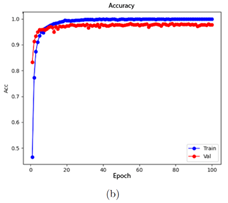
The performance of the selected models was analyzed on the test dataset, both in a controlled environment (test set) and under more challenging conditions, integrating classification metrics and their interpretation in light of the theoretical framework. Initially, the four models (M1, M4, M5, M6) were evaluated on the local test set (Loja images not used during training, 150 samples). All of them achieved an overall accuracy of 100% in this test, correctly classifying each image as either a “good” or “defective” bean (Figure 5). Consequently, their per-class metrics (precision, recall—sensitivity—and F1-score, the harmonic mean of precision and recall) reached values of 100% in both categories, demonstrating outstanding adaptation to the specific characteristics of Loja coffee beans.
Figure 5. Confusion matrix of the models on the test dataset.
Although a 100% accuracy suggests excellent performance, it is important to consider that this test set originates from the same domain and controlled conditions as the training data (same bean varieties, |
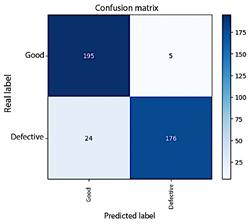
similar lighting, uniform background). From a critical perspective, a perfect result in a known environment may indicate model overfitting to specific conditions, making a more demanding test necessary to evaluate the models’ generalization capability. Generalization Test: For a more rigorous evaluation based on the CRISP-ML(Q) methodology, the model was subjected to a generalization test set composed of 400 additional images with greater variability (lighting conditions, background, capture device, among others), simulating a real-world environment. These images were captured using mobile devices under uncontrolled conditions to assess the robustness of the model. In this scenario, a marginal degradation in performance was observed; however, the overall model performance remained high. The best-performing model (configuration M4, see Table 1) achieved an overall accuracy of 93%, while the others were around 92%. Figure 6 shows the confusion matrix obtained by model M4 in this generalization test. It can be observed that, out of 200 real images from each class, the model correctly identified 195 “good” beans and 176 “defective” beans. Some errors were produced, with 5 false negatives and 24 false positives. These figures imply that, for the “good” class, a sensitivity (recall) of 97% and an F1-score (the harmonic mean of precision and recall) of 93% were achieved, while for the “defective” class, sensitivity was lower at 88% and the F1-score was 92%, mainly due to false positives. Despite this slight decrease in performance under more heterogeneous conditions, the model maintains an acceptable balance between precision and recall in both classes, avoiding a complete bias toward either of them. This suggests that the data balancing strategy and the incorporation of variability during training effectively contributed to achieving consistent classification across both bean categories. A more detailed analysis of the errors in the generalization test provides valuable insights. The 24 false positives are mainly attributed to uncontrolled capture conditions. Variable lighting in the test images, captured with mobile devices under uncontrolled conditions (in contrast to the training dataset), likely generated shadows that obscured subtle defects, leading the model to incorrect classification. On the other hand, the 5 false negatives can be explained by similar factors; pronounced shadows or natural spots on healthy beans may have been misinterpreted as defects by the model. Additionally, the lower resolution of mobile device cameras may have affected the clarity of bean details, contributing to these misclassifications. |
|
Figure 6. Confusion matrix of the model generalization test with the fourth configuration (M4).
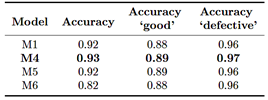
To complement these metrics, the classification report of model M4 yielded a balanced accuracy (macro average—the average of the metrics for each class) of 93%. This value, together with the high recall scores (97% for “good” and 88% for “defective”), confirms that the model maintains balanced performance and does not exhibit a significant bias toward either of the two classes, addressing one of the key concerns in classification tasks with imbalanced classes. Finally, although model M6 achieved the highest validation accuracy, model M4 demonstrated greater generalization capability on a more challenging and unseen dataset by exhibiting higher overall accuracy (93%), outperforming the other models (Table 3). In addition, it showed more uniform per-class metrics, in contrast to the other models which, despite having similar overall accuracy, exhibited small gaps between classes.
Table 3. Validation accuracy and loss values for each model in the hyperparameter optimization.
Class balance is fundamental in imbalanced binary classification tasks, as it indicates that the model does not prioritize the detection of one category over the other, but rather maintains a balanced and accurate recognition |
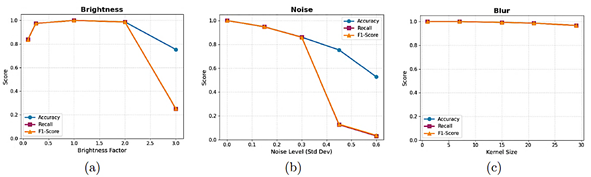
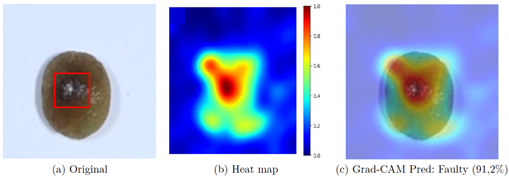
capability for both types of beans. The evaluation findings indicate that the fine-tuned Swin Transformer V2 model can achieve perfect results under controlled conditions; however, in more heterogeneous contexts, its accuracy may decrease, suggesting opportunities for improving the robustness of the implemented approach. Ablation Analysis: Additionally, to explain the performance divergence between the controlled environment (100%) and the generalization test (93%), a quantitative ablation study was conducted by subjecting the model to synthetic environmental degradations: brightness variations, noise, and blur (Figure 7). The analysis reveals that the architecture is highly robust to blur, maintaining an F1-score above 96% even with large blur kernels (Figure 7c), indicating that lack of sharpness in mobile photos is not a critical factor. However, the model showed sensitivity to extreme lighting conditions and noise. As observed in Figure 7a (Brightness), although the model tolerates moderate variations, severe overexposure (factor > 2.5) causes a drastic drop in Recall to 25%, preventing defect detection. Similarly, noise injection (Noise, Figure 7b) linearly degrades accuracy; with a standard deviation of 0.6, Recall drops to 3%, suggesting that digital grain generated by mobile sensors under low-light conditions affects the model’s ability to discern fine textures. These findings confirm that the 7% drop observed in the generalization test is mainly attributable to uncontrolled lighting factors and sensor noise, rather than focus-related issues. Interpretability Tests: To complement the quantitative analysis and ensure model interpretability, the Grad-CAM visualization technique was employed [21] This tool makes it possible to verify whether the neural network bases its predictions on relevant bean features or on spurious artifacts. Figure 8a presents the original image of a bean classified as defective, where the actual physical location of the defect prior to processing is delineated by a red bounding box. The subsequent visual results, shown in the heatmap (Figure 8b) and the Grad-CAM overlay (Figure 8c), demonstrate that the Swin Transformer model concentrates its highest activation (represented in red tones) precisely within the indicated defect area. This spatial correspondence between the real defect and the network’s attention empirically validates the model’s decision-making process, confirming that the classification is based on the morphology of the damage rather than background noise. |
|
Figure 7. Ablation analysis under environmental perturbations. (a) Impact of brightness variation (Brightness). (b) Impact of Gaussian noise (Noise). (c) Impact of blur (Blur). High stability to blur is observed, but a significant degradation of Recall under extreme noise and overexposure conditions. |
|
Figure 8. Interpretability analysis using Grad-CAM. (a) Original image with the defect manually highlighted by a red bounding box. (b) Attention heatmap generated by the model. (c) Grad-CAM overlay showing that the model’s activation coincides with the defect region. |
|
3.4.Discussion
The results obtained are contrasted below with recent studies on Arabica green coffee bean classification using artificial intelligence, especially those based on Vision Transformer and CNN architectures, in order to contextualize the performance of our approach for Loja coffee. First, the adapted Swin V2 model achieved internal validation accuracies of 98% and final generalization test accuracies of up to 93% overall. This performance aligns with the trend reported by recent works exploring Transformers in computer vision; for example, in [13], an accuracy of 84.75% was achieved using a Transformer-based architecture (Swin Transformer) in a multiclass classification task with the same USKCOFFEE dataset without modifications. In the present study, by simplifying the problem to binary classification and reinforcing it with local data and fine-tuning, a global validation accuracy of 98% was achieved. Similarly, in [15], a bean classification method using Swin Transformer oriented toward quality grading was proposed, also highlighting the potential of this |
architecture to capture relevant features in green coffee. The findings obtained support this evidence: Vision Transformers, when properly trained, can achieve very high accuracy in this task, even surpassing some traditional CNN models under similar scenarios. In controlled testing environments, the ViT model trained in the present study achieved 100% accuracy, surpassing the accuracies reported by CNNs in similar tasks. In [6], an optimized CNN was designed for defect detection in coffee beans, achieving 95.2% accuracy on its test set. In contrast, the present model achieved 100% accuracy in local tests and 93% in more complex testing scenarios, demonstrating the ability of ViTs to achieve performance comparable to or superior to CNNs in bean classification. However, it is necessary to contextualize these numbers. In [5], a lightweight and explainable CNN (LDCNN) was developed for green coffee quality detection, achieving 98.38% accuracy and a 98.24% F1 score on its test dataset. Likewise, Gope and Fukai [22] reported approximately 98.19% accuracy using a CNN to classify “peaberry” versus “normal” beans. These figures slightly surpass the 93% obtained by the model in the generalization test; however, it should be noted that these studies conducted evaluations in controlled environments or under fixed conditions. |
|
On the other hand, in [11], a MobileNetV3 architecture was used to classify defects in Thai Arabica coffee (multiclass task), achieving 88.63% accuracy, a value lower than the 93% reached by the model trained under a more complex generalization challenge. Overall, these comparisons suggest that the ViT-based approach used in this work is consistent with the surveyed state of the art, achieving favorable metric results compared to many previous CNN models, especially by simplifying the classification to two classes and by incorporating a new dataset specialized in the Loja region. At the same time, the robustness analysis reveals that, although the model outperforms previous architectures, there is still room for improvement to match the noise tolerance demonstrated by some CNNs, suggesting the need to include noise- and illumination-specific data augmentation in future work.
4. Conclusions
The creation and evaluation of the Vision Transformer model for the classification of Loja Arabica green coffee beans demonstrated a high discrimination capability, achieving an overall accuracy of 100% under controlled conditions and 93% in generalization tests with varied conditions. The adoption of the CRISP-ML(Q) methodology, together with the initial comparison of training methods using the USK-COFFEE dataset and the proprietary Loja dataset, enabled faster and more stable model convergence. Likewise, the manual optimization of hyperparameters—epochs, batch size, learning rate, dropout, and optimizer—proved to be key in refining its performance, achieving validation accuracies above 98% without large fluctuations among the evaluated configurations. These findings confirm the potential of Vision Transformers as a quality control tool in the coffee industry of Loja. Nevertheless, the slight decrease in accuracy under less ideal conditions demonstrates the existence of room for improvement, where the diversity of the dataset can be expanded, new data augmentation techniques can be incorporated, and hyperparameter optimization schemes can be explored. Consequently, this could strengthen generalization capability and ensure equally robust results in less controlled scenarios.
Acknowledgments
We extend our gratitude to the National University of Loja and the Computer Engineering program for the support and resources provided for this work. |
Contributor role
· Patricio Bolívar Betancourt Ludeña: writing – original draft, software and data curation. · Oscar M. Cumbicus Pineda: supervision and validation.
References
[1] ICP. (2025) I-CIP retreats on news of looser supply, relieving some of the upward pressure. Coffee market report. International Coffee Organization. [Online]. Available: https://upsalesiana.ec/ing35ar10r1 [2] Agricultura. (2025) 6425 hectáreas de café son renovadas en la provincia de Loja. Ministerio de Agricultura, Ganadería y Pesca. [Online]. Available: https://upsalesiana.ec/ing35ar10r2 [3] M. Faisal, J.-S. Leu, and J. T. Darmawan, “Model selection of hybrid feature fusion for coffee leaf disease classification,” IEEE Access, vol. 11, pp. 62 281–62 291, 2023. [Online]. Available: https://doi.org/10.1109/ACCESS.2023.3286935 [4] E. Hassan, “Enhancing coffee bean classification: a comparative analysis of pretrained deep learning models,” Neural Computing and Applications, vol. 36, no. 16, pp. 9023–9052, Apr. 2024. [Online]. Available: https://doi.org/10.1007/s00521-024-09623-z [5] C.-H. Hsia, Y.-H. Lee, and C.-F. Lai, “An explainable and lightweight deep convolutional neural network for quality detection of green coffee beans,” Applied Sciences, vol. 12, no. 21, p. 10966, Oct. 2022. [Online]. Available: https://doi.org/10.3390/app122110966 [6] S.-J. Chang and C.-Y. Huang, “Deep learning model for the inspection of coffee bean defects,” Applied Sciences, vol. 11, no. 17, p. 8226, Sep. 2021. [Online]. Available: https://doi.org/10.3390/app11178226 [7] A. Chavarro, D. Renza, and E. Moya-Albor, “Convnext as a basis for interpretability in coffee leaf rust classification,” Mathematics, vol. 12, no. 17, p. 2668, Aug. 2024. [Online]. Available: https://doi.org/10.3390/math12172668 [8] Y. A. Auliya, I. Fadah, Y. Baihaqi, and I. N. Awwaliyah, “Green bean classification: Fully convolutional neural network with Adam optimization,” Mathematical Modelling of Engineering Problems, vol. 11, no. 6, pp. 1641–1648, Jun. 2024. [Online]. Available: https://doi.org/10.18280/mmep.110626
|
|
[9] J. Maurício, I. Domingues, and J. Bernardino, “Comparing vision transformers and convolutional neural networks for image classification: A literature review,” Applied Sciences, vol. 13, no. 9, p. 5521, Apr. 2023. [Online]. Available: https://doi.org/10.3390/app13095521 [10] J. Wei, J. Chen, Y. Wang, H. Luo, and W. Li, “Improved deep learning image classification algorithm based on Swin Transformer V2,” PeerJ Computer Science, vol. 9, p. e1665, Oct. 2023. [Online]. Available: https://doi.org/10.7717/peerj-cs.1665 [11] S. Arwatchananukul, D. Xu, P. Charoenkwan, S. Aung Moon, and R. Saengrayap, “Implementing a deep learning model for defect classification in Thai Arabica green coffee beans,” Smart Agricultural Technology, vol. 9, p. 100680, Dec. 2024. [Online]. Available: https://doi.org/10.1016/j.atech.2024.100680 [12] W. Pinheiro Claro Gomes, L. Gonçalves, C. Barboza da Silva, and W. R. Melchert, “Application of multispectral imaging combined with machine learning models to discriminate special and traditional green coffee,” Computers and Electronics in Agriculture, vol. 198, p. 107097, Jul. 2022. [Online]. Available: https://doi.org/10.1016/j.compag.2022.107097 [13] M. N. Izza and G. P. Kusuma, “Image classification of Green Arabica Coffee using transformer-based architecture,” International Journal of Engineering Trends and Technology, vol. 72, no. 6, pp. 304–314, Jun. 2024. [Online]. Available: https://doi.org/10.14445/22315381/IJETT-V72I6P128 [14] H. F. Alhasson and S. S. Alharbi, “Classification of saudi coffee beans using a mobile application leveraging squeeze vision transformer technology,” Neural Computing and Applications, vol. 37, no. 14, pp. 8629–8649, Feb. 2025. [Online]. Available: https://doi.org/10.1007/s00521-025-11024-9 [15] Y. Jiao, Y. Zhao, A. Jia, T. Wang, J. Li, K. Xiang, H. Deng, M. He, R. Jiang, and Y. Zhang, “Swin-HSSAM: a green coffee bean grading method by swin transformer,” PLOS One, vol. 20, no. 5, p. e0322198, May 2025. [Online]. Available: https://doi.org/10.1371/JOURNAL.PONE.0322198
|
[16] J. H. L. Goh, E. Ang, S. Srinivasan, X. Lei, J. Loh, T. C. Quek, C. Xue, X. Xu, Y. Liu, C.-Y. Cheng, J. C. Rajapakse, and Y.-C. Tham, “Comparative analysis of vision transformers and conventional convolutional neural networks in detecting referable diabetic retinopathy,” Ophthalmology Science, vol. 4, no. 6, p. 100552, Nov. 2024. [Online]. Available: https://doi.org/10.1016/j.xops.2024.100552 [17] Z. Liu, H. Hu, Y. Lin, Z. Yao, Z. Xie, Y. Wei, J. Ning, Y. Cao, Z. Zhang, L. Dong, F. Wei, and B. Guo, “Swin Transformer V2: scaling up capacity and resolution,” arXiv, 2021. [Online]. Available: https://doi.org/10.48550/arXiv.2111.09883 [18] S. Studer, T. B. Bui, C. Drescher, A. Hanuschkin, L. Winkler, S. Peters, and K.-R. Müller, “Towards CRISP-ML(Q): a machine learning process model with quality assurance methodology,” Machine Learning and Knowledge Extraction, vol. 3, no. 2, pp. 392–413, Apr. 2021. [Online]. Available: https://doi.org/10.3390/make3020020 [19] A. Febriana, K. Muchtar, R. Dawood, and C.-Y. Lin, “USK-Coffee dataset: A multi-class green arabica coffee bean dataset for deep learning,” in 2022 IEEE International Conference on Cybernetics and Computational Intelligence (CyberneticsCom). IEEE, Jun. 2022, pp. 469–473. [Online]. Available: https://doi.org/10.1109/CyberneticsCom55287.2022.9865489 [20] Patricio Bolívar Betancourt Ludeña, “Lojano Arabica coffee,” Zenodo, 2025. [Online]. Available: https://doi.org/10.34740/kaggle/dsv/13947455 [21] R. R. Selvaraju, M. Cogswell, A. Das, R. Vedantam, D. Parikh, and D. Batra, “Grad-CAM: visual explanations from deep networks via gradient-based localization,” International Journal of Computer Vision, vol. 128, no. 2, pp. 336–359, Oct. 2019. [Online]. Available: http://dx.doi.org/10.1007/s11263-019-01228-7 [22] H. L. Gope and H. Fukai, “Peaberry and normal coffee bean classification using CNN, SVM, and KNN: their implementation in and the limitations of Raspberry Pi 3,” AIMS Agriculture and Food, vol. 7, no. 1, pp. 149–167, 2022. [Online]. Available: https://doi.org/10.3934/agrfood.2022010 |