|
Scientific Paper / Artículo Científico |
|
|
|
|
https://doi.org/10.17163/ings.n35.2026.02 |
|
|
|
pISSN: 1390-650X / eISSN: 1390-860X |
|
|
CLASSIFICATION OF UPPER LIMB FRACTURES USING DEEP LEARNING |
||
|
CLASIFICACIÓN DE FRACTURAS EN EXTREMIDADES SUPERIORES CON APRENDIZAJE PROFUNDO |
||
|
Gabriela
Jaén-Armijos1,* Wilmer
Rivas-Asanza1 |
|
Received: 30-04-2025, Received after review: 19-06-2025, Accepted: 09-09-2025, Published: 01-01-2026 |
|
Abstract |
Resumen |
|
Accurate identification of upper extremity fractures is essential for timely and reliable diagnosis in emergency medical settings. This study evaluates and compares the performance of three pre-trained deep learning architectures: EfficientNet- B4, ResNet-50, and ConvNeXt-Large, applied to the automatic classification of bone fractures in radiographic images from the MURA repository, encompassing seven anatomical regions. Advanced image preprocessing techniques, including Unsharp Masking and Contrast-Limited Adaptive Histogram Equalization (CLAHE), were employed in conjunction with data normalization and balancing strategies. The models were trained in two experimental setups: a binary classification distinguishing between “fracture” and “non-fracture” images, and a multiclass configuration identifying 14 distinct fracture types. Performance evaluation using F1-Score, sensitivity, accuracy, and ROC–AUC metrics demonstrated that ConvNeXt-Large achieved the highest overall results, reaching accuracies of 99.0% in binary classification and 99.4% in multiclass classification. These findings position ConvNeXt-Large as a highly promising tool for supporting early and precise fracture diagnosis. |
La identificación precisa de fracturas en las extremidades superiores es fundamental para un diagnóstico oportuno en los entornos de urgencias médicas. Este estudio analiza y compara el desempeño de tres modelos de aprendizaje profundo preentrenados: EfficientNet-B4, ResNet-50 y ConvNeXt-Large, aplicados a la clasificación automática de fracturas óseas en radiografías del repositorio MURA, distribuidas en siete regiones anatómicas. Se aplicaron técnicas avanzadas de preprocesamiento digital, como Unsharp Masking y CLAHE, junto con estrategias de normalización y balanceo de datos. El entrenamiento se llevó a cabo en dos experimentos: uno binario, que clasifica entre “fractura” y “no fractura”, y otro multiclase, con catorce tipos de fracturas identificadas. La evaluación, mediante métricas como F1-Score, sensibilidad, exactitud y curvas ROC-AUC, reveló que ConvNeXt-Large alcanzó el mejor rendimiento, logrando una precisión del 99,0% en clasificación binaria y del 99,4% en la clasificación multiclase. Estos resultados posicionan a ConvNeXt-Large como una herramienta altamente prometedora para apoyar el diagnóstico temprano de fracturas óseas. |
|
Keywords: Human extremities, Bone Fractures, Artificial Intelligence, X-ray, Artificial neural networks. |
Palabras clave: extremidades humanas, fracturas óseas, inteligencia artificial, radiografía, redes neuronales artificiales |
|
1,*Facultad de Ingeniería Civil, AutoMathFIC,
Universidad Técnica de Machala, Ecuador. Corresponding author ✉: gjaen1@utmachala.edu.ec.
Suggested citation: G. Jaén-Armijos, E. Morán-Castillo, W. Rivas-Asanza and E. Tusa. “Classification of upper limb fractures using deep learning,” Ingenius, Revista de Ciencia y Tecnología, N.◦ 35, pp. 21-35, 2026, doi: https://doi.org/10.17163/ings.n35.2026.02. |
|
1. Introduction
Bone fractures are among the most common injuries treated in hospital emergency departments [1]. The upper extremities play essential roles in human mobility and functionality; therefore, fractures involving regions such as the elbow, fingers, forearm, hand, humerus, shoulder, or wrist can significantly impair fine and gross motor skills. Such injuries limit the ability to perform daily activities and consequently diminish patients’ quality of life. At the global level, it is estimated that 10% to 40% of medical emergencies are attributable to upper limb injuries, corresponding to approximately six million cases annually in the United States and 700,000 in France [2]. In Medellín, Colombia, 25,646 cases of upper limb trauma were reported, of which 17% involved fractures [2]. These data emphasize the urgent need for faster and more accurate diagnostic procedures, as the error rate in fracture identification remains approximately 17.9% [3]. Although radiographs are widely used, their diagnostic accuracy remains limited, particularly in anatomically complex regions such as the upper extremities. Factors including improper adjustment of X-ray tube voltage and current parameters, manual interpretation of radiographic images, and excessive workload among medical personnel can significantly contribute to diagnostic errors [4]. In light of these challenges, the application of advanced artificial intelligence (AI) techniques, particularly deep learning, has emerged as a promising approach to improving diagnostic accuracy. These methods have consistently demonstrated the ability to enhance both accuracy and efficiency in medical image interpretation [5]. Artificial intelligence (AI) broadly refers to the ability of computer systems to perform tasks that typically require human intervention [6]. More specifically, deep learning, a subfield of AI, employs complex artificial neural networks to model and solve problems with remarkable capacity for abstraction and generalization [7]. An example of how these technologies are transforming medical practice is the study by Medaramatla et al. [8], which investigated fracture detection in hand bones using a hybrid YOLO-NAS system applied to X-ray images. In that study, a dataset comprising 4,736 hand bone radiographs was developed and classified into six categories, with images sourced from publicly available repositories such as Kaggle and Mendeley. To evaluate the performance of the proposed model, several algorithms were compared, including YOLO-NAS, EfficientDet, ResNet-50, InceptionV3, Vision Transformer, VGG19, and YOLOv8. The hybrid |
YOLONAS model achieved an accuracy of 97.9%, outperforming all other evaluated methods. Similarly,Wang [9] developed a deep learning-based approach using the Keras library and the NASNetMobile model for detecting bone fractures in the upper extremities. The model was trained on the MURA dataset and achieved an accuracy of approximately 70%, demonstrating the potential of deep learning in medical imaging applications. In another study, Guan et al. [10] used approximately 4,000 images from the MURA dataset and proposed a two-stage R-CNN-based framework for detecting fractures in arm radiographs. The model achieved an accuracy of 62%, demonstrating the potential of R-CNN architectures to support the diagnosis of upper-limb injuries. Although the reviewed studies report promising results in the automatic detection of bone fractures, their findings reveal significant limitations that restrict practical implementation in real clinical settings. This underscores the need to develop new strategies to overcome these challenges. For example, the model proposed by Guan et al. [10] achieved a performance below 80% due to the limited number of images used during training. Consequently, employing a larger and more diverse dataset would be an effective strategy to enhance the model’s robustness and reliability in clinical practice. Image quality represents another limitation identified in the studies reviewed. In these investigations, model accuracy was affected by image noise and insufficient preprocessing. In the case of Medaramatla et al. [8], the images were resized to a square format of 608 × 608 pixels (PNG), and a manual noise removal process was applied to low-quality samples. Although this cleaning procedure improved image quality and model accuracy, it lacks the scalability and robustness required to ensure consistency in large-scale clinical settings. Based on these limitations, the following research question arises: How can accuracy and robustness to class imbalance be improved in the automatic classification of upper-limb bone fractures from radiographic images through the implementation of pre-trained deep learning models? To address this question, pre-trained deep learning models such as EfficientNet-B4 [11], ResNet-50 [12], and ConvNeXt-Large [13] are compared and evaluated using performance metrics including F1-score, precision, accuracy, sensitivity, the receiver operating characteristic (ROC) curve, and the confusion matrix. The primary objective of this study is to determine which of the three proposed models provides the best performance in the automatic classification of bone fractures in the upper extremities. |
|
2. Materials and Methods
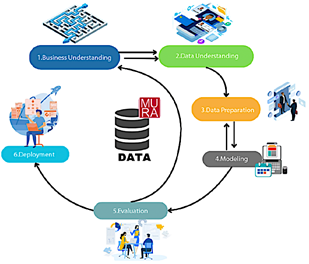
The research follows a quantitative and experimental approach focused on comparing and validating pretrained deep learning models for the automatic classification of upper-limb bone fractures from radiographic images. For the implementation and evaluation of the models, the CRISP-DM approach was adopted, which provides a systematic and structured framework for data analysis [14]. Figure 1 illustrates the main phases and objectives of the process.
Figure 1. Study methodology consisting of six phases
These phases are described as follows:
· Business understanding: analysis of the context, definition of the project objectives, and identification of available resources [15]. · Data understanding: examination of data quality, structure, and characteristics to obtain a clear overview of its content [16]. · Data preparation: handling of missing values, normalization, selection of key variables, and conversion of data into suitable formats. · Modeling: construction, training, and evaluation of the model to ensure its effectiveness and reliability [17]. · Evaluation: verification of objective achievement and assessment of model performance according to predefined criteria [18]. · Deployment: continuous integration, monitoring, and maintenance of the model to ensure optimal performance and periodic updates [19]. |
2.1.Business Understanding
The automatic classification of bone fractures in radiographs requires high accuracy, efficiency, and specialized expertise. However, the growing demand for radiological examinations, coupled with the shortage of radiology professionals, often leads to diagnostic delays and an increased likelihood of errors. Although several computational tools have been developed, few are specifically tailored for the detection and classification of bone fractures. In this context, the present study implements and evaluates pre-trained deep learning models for the classification of bone fractures in the upper extremities.
2.2.Data Understanding
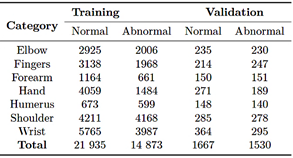
The dataset used for the automatic classification of upper-limb fractures corresponds to a large collection of musculoskeletal radiographs known as MURA [20]. This dataset comprises 40,561 radiographic images from 14,863 studies involving12,173 patients. The images cover various anatomical regions, including the elbow, fingers, forearm, hand, humerus, shoulder, and wrist. Each study was previously labeled as normal or abnormal by certified radiologists endorsed by the Stanford Hospital board, based on diagnoses made between 2001 and 2012 [21]. In its original distribution, the MURA dataset [20] is divided into three subsets: a training set with 36,808 images (90.7%), a validation set with 3,197 images (7.9%), and a test set with 556 images (1.4%). Table 1 summarizes the original distribution of the dataset.
Table 1. Original distribution of the MURA dataset
2.3.Data Preparation
Data preprocessing is a crucial stage in data mining, as it enables the correction of noise, inconsistencies, and missing values that may compromise the model’s reliability [22]. During the review of the original MURA dataset [20], 40,009 images were obtained. After a |
|
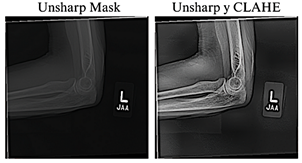
thorough analysis, four images in an incompatible format were identified and excluded in subsequent preprocessing stages, thereby confirming the total of 40,005 images reported by the authors [23]. The resulting 40,005 images were normalized and resized to 384 × 384 pixels to maintain a balance between preserving relevant details, ensuring computational efficiency, and achieving consistency with the pre-trained models. To improve the visual quality of the radiographs, the Unsharp Masking technique, used to emphasize edges and fine details [24], and CLAHE, which improves contrast in low-quality images without introducing unwanted artifacts [25], were applied. Previous studies have shown that combining these techniques significantly enhances visibility in low-light images [26], as illustrated in Figure 2.
Figure 2. Application of radiographic image enhancement techniques. The image on the left shows the result obtained using Unsharp Mask, while the image on the right illustrates the effect of combining Unsharp Mask with CLAHE.
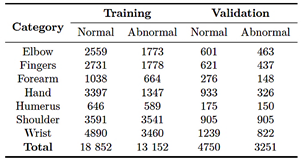
After completing the image cleaning and quality enhancement stages, the dataset was redistributed as part of preprocessing phase: 80.0% for training and 20.0% for validation, as shown in Table 2.
Table 2. Redistribution of the MURA dataset
In this stage, three pre-trained deep learning models were implemented: EfficientNet-B4, ResNet-50, and ConvNeXt-Large. Training was conducted in a Python |
environment using libraries such as PyTorch, Albumentations, and Scikit-learn, across three hardware configurations: an NVIDIA RTX 3050 GPU (8 GB), an NVIDIA RTX 4060 GPU (12 GB), and an NVIDIA A100 GPU accessed through Google Colab Pro (40 GB). These configurations enabled the evaluation of performance and resource consumption, utilizing the NVIDIA A100 GPU accessed through GoogleColab Pro for intensive testing of more complex models, such as ConvNeXt-Large. Under these conditions, the training was structured into three phases.
1. First phase: a binary classification was performed to distinguish between images with fractures and those without fractures. 2. Second phase: a multiclass classification was performed using the MURA dataset in its original structure. 3. Third phase: a multiclass training was conducted with the preprocessed and resized dataset.
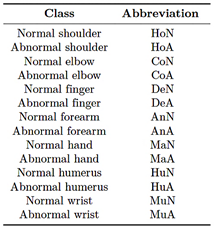
Table 3 summarizes the labeling scheme used for the multiclass classification.
Table 3. Class labeling for multiclass classification
2.4.1. EfficientNet-B4
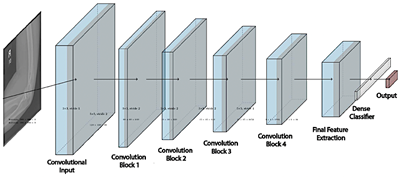
EfficientNet is a convolutional neural network architecture that optimizes the balance among network depth, width, and resolution [27]. The EfficientNet-B4 model consists of 24 layers and approximately 19.3 million parameters, most of them trainable (weights and biases) with a small, fixed proportion (mean and variance). This configuration enhances the model’s ability to extract complex features but also increases computational demand and the risk of overfitting, see figure 3. |
|
Figure 3. EfficientNet-B4 architecture |
|
Phase 1
The training process was conducted in two stages, using a batch size of eight images per iteration. In the first stage, the model was trained for 30 epochs with the last 100 layers frozen and a learning rate of 1 × 10⁻³. In the second stage, fine-tuning was performed for 25 epochs with all layers unfrozen, while the learning rate was reduced to 1 × 10⁻⁵. Data augmentation techniques, including rotations, shifts, and scaling, were applied to increase the variability of the training set. In addition, a validation loss monitoring strategy was implemented to halt training in the absence of improvement and to dynamically adjust the learning rate.
Phase 2
In the multiclass training, a batch size of eight images was used. In the first stage, only the output layer was trained for 30 epochs with a learning rate of 1 × 10⁻³. In the second stage, fine-tuning was performed by unfreezing all layers for an additional 30 epochs, while reducing the learning rate to 1 × 10⁻⁵ to achieve a more precise adjustment of the model’s weights. As part of the training workflow, custom class weights were calculated to compensate for the class imbalance in the training set.
Phase 3
During training, data augmentation was performed directly on the GPU using the Kornia library [28], which applied random rotations of up to 30°, horizontal flips, brightness variations, and normalization. For validation, the data were only normalized to maintain statistical consistency with the training set. |
To address class imbalance, class weights were automatically calculated using a function described in Equation (1).
Where wi is the weight of class i, nsamples represents the total number of samples, n(clases) corresponds to the number of classes, and nsamples indicates the number of samples belonging to class i. Additionally, the cross-entropy loss function was employed, converting the model outputs into normalized probabilities that can be directly compared with the true labels. The training structure used in Phase 2 was maintained, and mixed-precision operations were automatically incorporated [29]. Finally, dynamic loss scaling was applied to ensure numerical stability during training [30].
2.4.2. ResNet-50
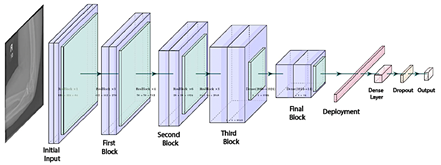
ResNet is a convolutional neural network architecture based on residual blocks and skip connections, designed to mitigate issues such as gradient vanishing and to facilitate the training of deeper networks [31]. The ResNet-50 model comprises 50 layers, enabling it to extract detailed visual features from images, as illustrated in Figure 4 [12].
Phase 1
For binary training, a batch size of 32 images was used, following a two-stage strategy that included initial training with frozen layers and subsequent fine tuning. |
|
In the first stage, the base model layers were frozen, and a custom classifier was added, consisting of two dense layers with 1,024 and 512 units, normalization, the Swish activation function, and a 50% dropout rate, culminating in a sigmoid output layer for binary classification. Various transformations were applied to the training set, including pixel normalization, rotations, shifts of up to 30%, zooming up to 40%, random cropping, brightness adjustments, and horizontal flips. |
In the first stage, the model head was trained for 40 epochs with a learning rate of 1 × 10⁻⁴; in the second stage, the last 150 layers were unfrozen, and fine-tuning continued for an additional 40 epochs using a reduced learning rate of 1 × 10⁻⁶ to preserve the stability of the pre-trained weights. |
|
Figure 4. ResNet-50 Architecture |
|
Phase 2
In this phase, no data augmentation was applied. The training was conducted in two stages: in the first, the base layers of the model were kept frozen, and only the top layers were trained with a learning rate of 1×10⁻⁴; in the second, starting from epoch 40, fine-tuning was performed with the learning rate reduced to 1 × 10⁻⁶.
Phase 3
In the third phase, a batch size of 64 images was used. The training set underwent random horizontal flipping, rotations within a ± 30° range, and normalization, with the mean and standard deviation adjusted to 0.5. Additionally, class weights were automatically computed using the compute_class_weight function, as described in Phase 3, Section 2.4.1. |
For training, the final layer of the model was replaced with an output of 14 neurons, preceded by a dense layer with 512 units, batch normalization, a nonlinear activation function, and a 50.0% dropout rate. The process was maintained in two stages, incorporating mixed-precision training techniques to optimize GPU resource utilization.
2.4.3. ConvNeXt-Large
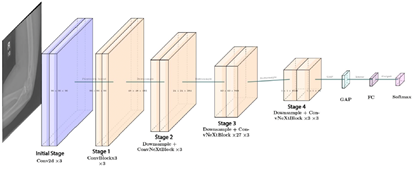
ConvNeXt-Large is a convolutional neural network architecture composed of multiple identical modules, which facilitates model scalability and maintenance [32]. Figure 5 illustrates its 24-layer structure, enabling the extraction of subtle differences and complex details in images, capabilities that are particularly valuable for medical image classification tasks [13]. |
|
Figure 5. ConvNeXt-Large Architecture |
|
Phase 1
In the first phase of the binary training of ConvNeXt- Large, data augmentation was applied through brightness and contrast adjustments, motion blur, rotations of ± 20º, random cropping, horizontal flipping, and normalization to the range [-1, 1]. A composite loss function was employed, combining 30% Binary Cross-Entropy (BCE) [33], which measures the discrepancy between the model’s predictions and the true labels, and 70% Focal Loss [34], which reduces the influence of easy examples while emphasizing more difficult ones. The model was trained for 30 epochs, incorporating CutMix [35] and progressive fine-tuning. Initially, only the model head was trained, while from epochs 3 and 8, the deeper layers were gradually unfrozen. Starting at epoch 5, the classification threshold was dynamically adjusted, and validation errors were reintegrated every 5 epochs.
Phase 2
In the second phase, the model was fine-tuned for multiclass classification across14 categories, without applying data augmentation, using a custom dataset built from CSV files to facilitate image loading and normalization. The training was performed with batches of 16 images, employing the CrossEntropyLoss function, as described in Phase 3, Section 2.4.1, and the AdamW optimizer, which updates parameters with adaptive learning rates and applies weight regularization to improve the stability of the learning process. The training began with the base model frozen, progressively unfreezing the last 10 layers from epoch 3 and the entire architecture from epoch 8 onward.
Phase 3
In the third and final phase, generalization capability was enhanced through advanced data transformations, including horizontal flipping, discrete rotations of 90º, 180º, and 270º, elastic distortions, Gaussian blur, and random brightness and contrast adjustments. Oversampling was applied by replicating minority-class examples to balance the dataset. Additionally, a custom loss function was implemented, incorporating error detection every 5 epochs and the use of CutMix [35]. The training began with the model head for 2 epochs; from epoch 3, the last 10 layers were activated, and from epoch 8 onward, full fine-tuning was enabled. |
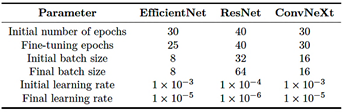
Table 4 summarizes the configurations used for EfficientNet-B4, ResNet-50, and ConvNeXt-Large, including the number of epochs, batch sizes [36], and learning rates, with specific adjustments for multiclass classification.
Table 4. Summary of training configurations by model
2.4.4. Computational effort
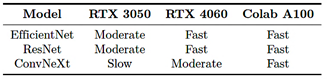
Computational effort refers to the resources required to train and execute a model, including memory usage, training time, and processing capacity [37]. In this study, the models exhibited notable differences across the three hardware configurations employed, which are described below.
· Configuration 1 (GPU NVIDIA RTX 3050, 8 GB VRAM): mid-range GPU designed for home users or basic workstations, based on the Ampere architecture and suitable for generalpurpose graphics processing and accelerated computing tasks. · Configuration 2 (GPU NVIDIA RTX 4060, 12 GB VRAM): a high-end consumer GPU built on the Ada Lovelace architecture, offering higher performance for deep learning workloads. · Configuration 3 (Google Colab Pro con GPU A100, 40 GB VRAM): a highperformance GPU based on the Ampere architecture, optimized for intensive processing and deep neural network training.
The training process required a high computational load: EfficientNet-B4 exhibited moderate demand, ResNet-50 required less time and memory, and ConvNeXt-Large was the most resource-intensive. Therefore, the PyTorch function torch.cuda.empty_cache() was employed to release GPU memory and reduce the risk of saturation [38]. Table 5 summarizes the observed training performance across the different hardware configurations used. The performance levels are interpreted as follows: |
|
· Slow: total training time greater than 12 hours. · Moderate: total training time between 4 and 12 hours. · Fast: total training time less than 4 hours.
Table 5. Comparison of model training speed
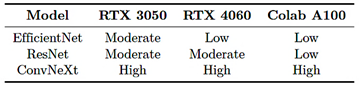
Similarly, Table 6 presents the observed memory usage during training across the different environments evaluated. The memory utilization levels are interpreted as follows:
· Low: maximum VRAM utilization below 50% of the total available GPU capacity. · Moderate: VRAM utilization between 50% and 80%. · High: VRAM utilization above 80%, with an increased risk of saturation.
Table 6. Comparison of model memory usage
2.5. Evaluation
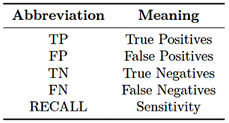
This section analyzes the performance of the EfficientNet-B4, ResNet-50, and ConvNeXt-Large models in bone fracture classification using evaluation metrics such as F1-score, precision, accuracy, sensitivity, receiver operating characteristic (ROC) curve, and confusion matrix. The abbreviations used in the equations are detailed in Table 7.
Table 7. Evaluation terms
The metrics used for performance evaluation are described below. |
F1-score
The F1-score is the harmonic mean of precision and sensitivity, particularly useful in imbalanced datasets as it provides a balanced assessment of classification performance [39].
Precision
Precision measures the proportion of positive predictions that are correct, indicating a low incidence of false positives [40].
Accuracy
Accuracy measures the overall proportion of correct predictions and is particularly relevant when the classes are balanced [41].
Sensitivity
Sensitivity reflects the model’s ability to correctly identify true positives; high sensitivity indicates a low number of false negatives [39].
Confusion matrix
The confusion matrix provides the TP, FP, FN, and TN values, facilitating performance evaluation and the identification of model errors [42].
Receiver Operating Characteristic (ROC) curve
The receiver operating characteristic (ROC) curve represents the relationship between sensitivity and the false positive rate, enabling the analysis of the model’s discriminative ability and visualization of its overall performance [43]. |
|
3. Results and discussion
Phase 1
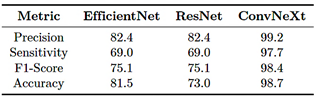
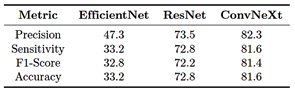
As shown in Table 8, ConvNeXt-Large outperforms EfficientNet-B4 and ResNet-50 across all evaluated metrics, achieving a precision of 99.2%, a sensitivity of 97.7%, and an F1-score of 98.4%, demonstrating its strong ability to classify bone fractures with a low false positive rate. In contrast, EfficientNet-B4 and ResNet-50 performance but lower effectiveness in correctly identifying positive cases. These results indicate that ConvNeXt-Large provides the best balance between precision, sensitivity, and generalization capability.
Table 8. Evaluation metrics (in percentage) – Phase 1
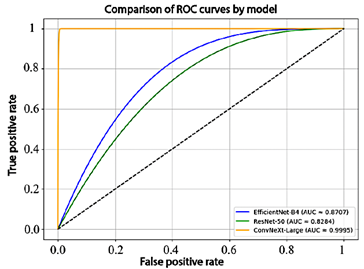
To complement these results, the receiver operating characteristic (ROC) curves and the corresponding area under the curve (AUC) values for each model are presented in Figure 6. EfficientNet-B4 achieved an AUC of 87.1%, ResNet-50 obtained 82.8%, and ConvNeXt-Large reached 99.9%, demonstrating an almost perfect ability to discriminate between classes.
Figure 6. Comparison of model performance using ROC curves
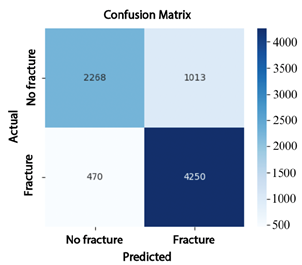
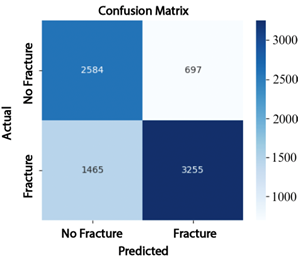
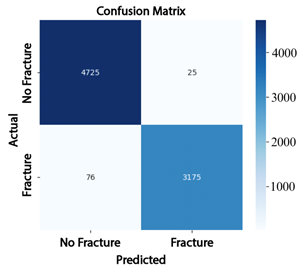
The analysis of the confusion matrices reinforces these findings: EfficientNet-B4 (Figure 7) produced 1013 false positives (FP) and 470 false negatives (FN); ResNet-50 (Figure 8) reduced the number of false negatives to 697 but increased false positives to 1465; whereas ConvNeXt-Large (Figure 9) achieved the best performance, with only 76 false positives and 25 false negatives, demonstrating superior classification accuracy. |
Figure 7. Confusion matrix of EfficientNet-B4
Figure 8. Confusion matrix of ResNet-50
Figure 9. Confusion matrix of ConvNeXt-Large
Phase 2
In Phase 2, the multiclass training results indicate that the ConvNeXt-Large model achieved an overall precision of 82.3%, a sensitivity of 81.6%, an F1-score of 81.4%, and an accuracy of 81.3%. These results are summarized in Table 9.
Table 9. Evaluation metrics (in percentage) – Phase 2
|
|
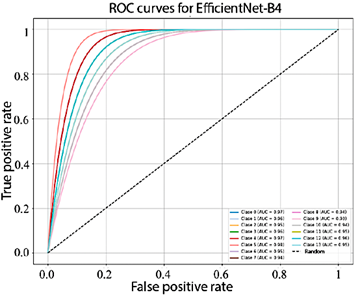
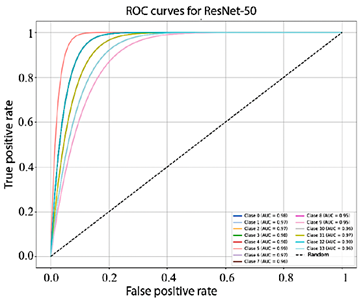
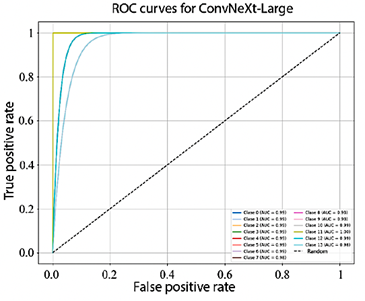
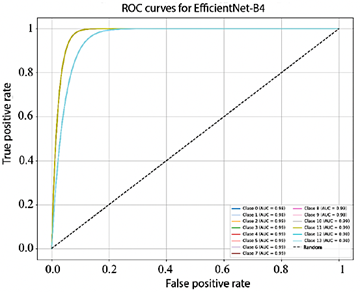
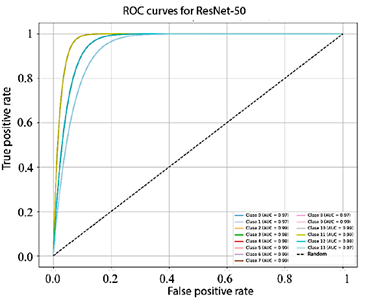
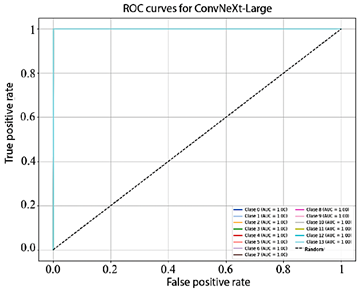
Figure 10 shows that the AUC values obtained by EfficientNet-B4 for each class range between 93.0% and 98.0%. In turn, Figure 11, corresponding to ResNet-50, presents AUC values ranging from 95.0% to 99.0%. Finally, Figure 12 illustrates the AUC curves of ConvNeXt-Large, which range from 98.0% to 100.0%, demonstrating outstanding performance and excellent class discrimination capability.
Figure 10. Receiver operating characteristic (ROC) curves for multiclass EfficientNet-B4
Figure 11. Receiver operating characteristic (ROC) curves for multiclass ResNet-50.
Figure 12. Receiver operating characteristic (ROC) curves for multiclass ConvNeXt-Large.
|
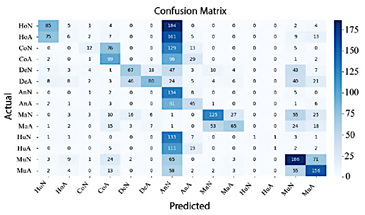
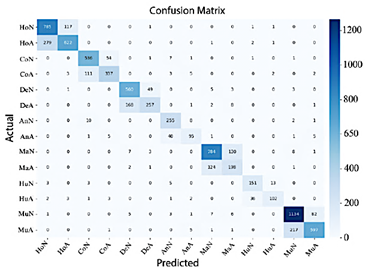
In Figure 13, EfficientNet-B4 demonstrates limited performance, as evidenced by the numerous misclassifications in the classes Normal Elbow and Normal Hand. In contrast, Abnormal Finger, Abnormal Hand, and Normal Wrist exhibit high precision.
Figure 13. Confusion matrix of EfficientNet-B4
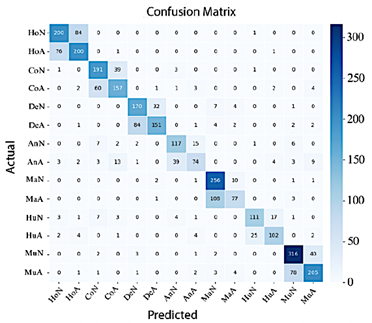
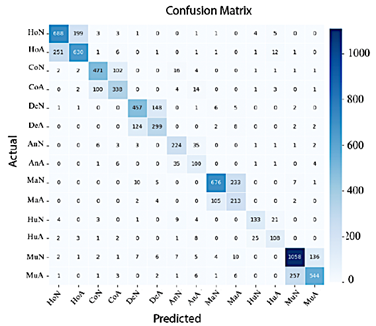
Conversely, Figure 14 shows that ResNet-50 achieves improved classification performance; in this case, most classes are correctly concentrated along the diagonal of the confusion matrix, although misclassifications between Normal Shoulder and Abnormal Wrist remain.
Figure 14. Confusion matrix of ResNet-50
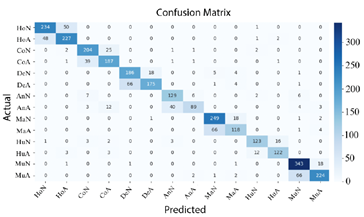
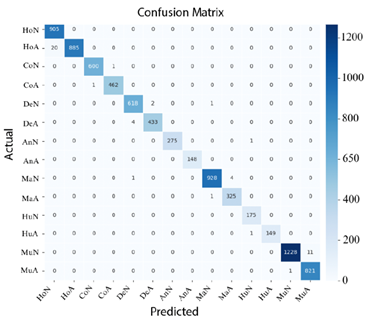
Finally, in Figure 15 shows that ConvNeXt-Large achieved the best performance, delivering highly precise classifications with a minimal number of errors.
Figure 15. Confusion matrix of ConvNeXt-Large |
|
Phase 3
Based on the results presented in Table 10, ConvNeXt-Large maintained its superiority in multiclass classification, clearly outperforming the other models across all evaluation metrics. Its precision, sensitivity, F1-score, and accuracy reached 99.4%, confirming ConvNeXt-Large as the most robust and effective model for the fracture classification task.
Table 10. Evaluation metrics (in percentage) – Phase 3
When examining the confusion matrices corresponding to Phase 3, it can be observed that, in Figure 16, the AUC values of EfficientNet-B4 range from 98.0% to 99.0%.
Figure 16. Receiver operating characteristic (ROC) curves for multiclass EfficientNet-B4
In the case of ResNet-50, the AUC values range from 97.0% to 99.0%, as shown in Figre 17.
Figure 17. Receiver operating characteristic curves (ROC) for multiclass ResNet-50 |
Finally, as illustrated in Figure 18, all classes in ConvNeXt-Large achieved an AUC of 100.0%, demonstrating its exceptional performance and near-perfect classification capability.
Figure 18. Receiver operating characteristic (ROC) curves for multiclass ConvNeXt-Large
Figures 19, 20, and 21 confirm that ConvNeXt-Large is the most effective model, exhibiting minimal dispersion outside the main diagonal and a superior ability to differentiate between classes.
Figure 19. Confusion matrix of EfficientNet-B4
Figure 20. Confusion matrix of ResNet-50 |
|
Figure 21. Confusion matrix of ConvNeXt-Large
The excellent performance of ConvNeXt-Large in handling class imbalance can be attributed to the use of advanced data augmentation strategies, which reduced overfitting and enhanced generalization capability, allowing the model to outperform EfficientNet-B4 and ResNet-50 across all evaluated phases.
Comparison with related works
The proposed ConvNeXt-Large model outperformed results reported in previous studies, achieving an accuracy of up to 99.4%, compared with 62.0% for RCNN [10] and 86.8% for DenseNet121 [23], thereby demonstrating superior robustness even when handling imbalanced datasets.
Limitations, challenges for clinical application, and ethical considerations
Although the results obtained demonstrate high performance, their clinical implementation requires more comprehensive analysis. Deployment in real-world settings presents challenges such as variability in radiological equipment, differences in image quality, and anatomical diversity among patients, all of which necessitate validating the model across a wide range of clinical scenarios. Additionally, there is a potential risk of overfitting, as the model was trained in a controlled environment that may not fully represent real-world clinical conditions. Therefore, external validation using heterogeneous datasets is essential to ensure reliability and generalizability. In terms of reproducibility, it is crucial that the results can be replicated by other researchers employing different datasets and experimental configurations, thereby strengthening confidence in the findings and supporting clinical adoption. |
Finally, from an ethical and regulatory perspective, it is imperative to guarantee model transparency, the protection and anonymization of patient data, and the clear delineation of responsibilities in the event of diagnostic errors. These measures are fundamental to ensuring the safe, ethical, and trustworthy application of artificial intelligence systems in healthcare, always prioritizing patient well-being.
4. Conclusions
This study evaluated the EfficientNet-B4, ResNet-50, and ConvNeXt-Large models for the automatic classification of upper-limb bone fractures using digital radiographs. The findings demonstrated that ConvNeXt- Large outperformed the other models, achieving accuracies of 99.2% in binary classification, 82.3% in multiclass classification with original data, and 99.4% in multiclass classification with preprocessed data. The combination of deep learning strategies, including image preprocessing, data augmentation, dynamic threshold adjustment, and progressive fine-tuning, proved essential for achieving its high performance. Although EfficientNet-B4 and ResNet-50 achieved satisfactory results, their lower sensitivity and challenges in handling class imbalance could present risks in clinical applications, where missing a fracture may have critical implications. Overall, the results position ConvNeXt-Large as a promising tool for supporting medical diagnosis and integration into automated radiographic analysis systems for upper-limb fractures. A key challenge identified involves the inherent complexity of fracture patterns, underscoring the need to explore advanced resampling methods and specialized augmentation strategies, such as clinical transformations or synthetic data generation using generative networks, to further enhance diagnostic accuracy and model robustness in future research.
Code availability
The code used for data processing, model training, and figure generation in the study on upper-limb fracture classification using deep learning is publicly available in the following GitHub repository [44].
Contributor Roles
· Gabriela Jaén-Armijos: data curation, formal analysis, investigation, software, writing – original draft. |
|
· Evelyn Morán-Castillo: investigation, methodology, formal analysis software, writing – original draft. · Wilmer Rivas-Asanza: supervision, validation, writing – review & editing. · Eduardo Tusa: supervision, validation, writing – review & editing.
References
[1] J. S. Alvarez Silva, J. E. Chávez Guerrero, D. S. Gutiérrez Carvajal, and L. B. Santos Rivas, “Manejo de emergencias en traumatología,” Polo del conocimiento, vol. 8, no. 4, pp. 2392–2414, 2023. [Online]. Available: https://upsalesiana.ec/ing35ar2r1 [2] E. M. Bitar Benítez, S. Gaviria Posada, N. d. León Fernández, and S. Gallego Gónima, “Epidemiología del trauma de miembro superior atendido en seis instituciones de salud de la ciudad de medellín, colombia, en 2016,” Cirugía Plástica Ibero-Latinoamericana, vol. 47, no. 3, pp. 323–332, Sep. 2021. [Online]. Available: https://dx.doi.org/10.4321/s0376-78922021000300014 [3] Y. Xie, X. Li, F. Chen, R. Wen, Y. Jing, C. Liu, and J. Wang, “Artificial intelligence diagnostic model for multi-site fracture x-ray images of extremities based on deep convolutional neural networks,” Quantitative Imaging in Medicine and Surgery, vol. 14, no. 2, pp. 1930–1943, Feb. 2024. [Online]. Available: https://dx.doi.org/10.21037/qims-23-878 [4] A. Said, T. D. M. Abbas Al-Adilee, and P. Rajeswari, “Enhancing bone fracture diagnosis with deep learning,” in Conference: 5th International Conference on Data Engineering and Communication Technology (ICDECT)At: Kuala Lumpur, Malaysia, 09 2024. [Online]. Available: https://upsalesiana.ec/ing35ar2r4 [5] Z. Alammar, L. Alzubaidi, J. Zhang, J. Santamaría, Y. Li, and Y. Gu, “A concise review on deep learning for musculoskeletal x-ray images,” in 2022 International Conference on Digital Image Computing: Techniques and Applications (DICTA). IEEE, Nov. 2022, pp. 1–8. [Online]. Available: https://doi.org/10.1109/DICTA56598.2022.10034618
|
[6] A. Pérez del Barrio, P. Menéndez Fernández-Miranda, P. Sanz Bellón, L. Lloret Iglesias, and D. Rodríguez González, “Inteligencia artificial en radiología: introducción a los conceptos más importantes,” Radiología, vol. 64, no. 3, pp. 228–236, May 2022. [Online]. Available: https://doi.org/10.1016/j.rx.2022.03.003 [7] J. D. Maravilla González, “Integración de la inteligencia artificial en la contabilidad forense: Herramientas y eficacia en la detección de fraudes: Integration of artificial intelligence in forensic accounting: Tools and effectiveness in fraud detection,” LATAM Revista Latinoamericana de Ciencias Sociales y Humanidades, vol. 5, no. 4, Aug. 2024. [Online]. Available: https://doi.org/10.56712/latam.v5i4.2460 [8] S. C. Medaramatla, C. V. Samhitha, S. D. Pande, and S. R. Vinta, “Detection of hand bone fractures in x-ray images using hybrid yolo nas,” IEEE Access, vol. 12, pp. 57 661–57 673, 2024. [Online]. Available: https://doi.org/10.1109/ACCESS.2024.3379760 [9] J. Wang, “Anomaly detection of arm x-ray based on deep learning,” IOP Conference Series: Earth and Environmental Science, vol. 440, no. 4, p. 042056, Feb. 2020. [Online]. Available: https://doi.org/10.1088/1755-1315/440/4/042056 [10] B. Guan, G. Zhang, J. Yao, X. Wang, and M. Wang, “Arm fracture detection in x-rays based on improved deep convolutional neural network,” Computers & Electrical Engineering, vol. 81, p. 106530, Jan. 2020. [Online]. Available: https://doi.org/10.1016/j.compeleceng.2019.106530 [11] A. Pak, A. Ziyaden, K. Tukeshev, A. Jaxylykova, and D. Abdullina, “Comparative analysis of deep learning methods of detection of diabetic retinopathy,” Cogent Engineering, vol. 7, no. 1, Jan. 2020. [Online]. Available: https://doi.org/10.1080/23311916.2020.1805144 [12] M. A. Thaarakaraam, M. M. Reddy, and V. Vijayakumar, “Cnn based bone fracture detection for medical imaging using resnet-50,” International Journal of Technical Research & Science, vol. 9, no. Spl, pp. 27–35, Jun. 2024. [Online]. Available: https://doi.org/10.30780/specialissue-iset-2024/038
|
|
[13] Z. Li, T. Gu, B. Li, W. Xu, X. He, and X. Hui, “Convnext-based fine-grained image classification and bilinear attention mechanism model,” Applied Sciences, vol. 12, no. 18, p. 9016, Sep. 2022. [Online]. Available: https://doi.org/10.3390/app12189016 [14] C. A. Mejia Rodriguez, M. A. Rincon Pinzon, L. M. Palmera Quintero, and L. M. Arevalo Vergel, “Aplicación de machine learning y metodología crisp-dm para la clasificación precisa de severidad en casos de dengue,” REVISTA COLOMBIANA DE TECNOLOGIAS DE AVANZADA (RCTA), vol. 1, no. 43, pp. 78–85, Mar. 2024. [Online]. Available: https://doi.org/10.24054/rcta.v1i43.2822 [15] C. Schröer, F. Kruse, and J. M. Gómez, “A systematic literature review on applying crisp-dm process model,” Procedia Computer Science, vol. 181, pp. 526–534, 2021. [Online]. Available: https://doi.org/10.1016/j.procs.2021.01.199 [16] D. Dzulhijjah, M. Herlambang, and M. Haifan, “Implementasi framework crisp-dm untuk proses data mining aplikasi credit scoring pt. xyz,” in Seminar Nasional Sains dan Teknologi "SainTek", 06 2024. [Online]. Available: https://upsalesiana.ec/ing35ar2r16 [17] V. Garcia-Rios, M. Marres-Salhuana, F. Sierra Liñan, and M. Cabanillas-Carbonell, “Predictive machine learning applying cross industry standard process for data mining for the diagnosis of diabetes mellitus type 2,” IAES International Journal of Artificial Intelligence (IJ-AI), vol. 12, no. 4, p. 1713, Dec. 2023. [Online]. Available: https://doi.org/10.11591/ijai.v12.i4.pp1713-1726 [18] G. Emmanuel, G. G. Hungilo, and A. W. R. Emanuel, “Performance evaluation of machine learning classification techniques for diabetes disease,” IOP Conference Series: Materials Science and Engineering, vol. 1098, no. 5, p.052082, Mar. 2021. [Online]. Available: https://doi.org/10.1088/1757-899X/1098/5/052082 [19] E. B. N. Arias, Beatríz M. González Nuñez, Lisset Nonell Fernández, and J. M. R. Pupo, “CRISP-DM y K-means neutrosofía en el análisis de factores de riesgo de pérdida de audición en niños,” Neutrosophic Computing and Machine Learning, vol. 16, p. 73, 2021. [Online]. Available: https://doi.org/10.5281/zenodo.4679890 [20] ML Group. (2025) Bone x-ray deep learning competition. Stanford ML Group. [Online]. Available: https://upsalesiana.ec/ing35ar2r20
|
[21] I. Kandel and M. Castelli, “Improving convolutional neural networks performance for image classification using test time augmentation: a case study using mura dataset,” Health Information Science and Systems, vol. 9, no. 1, Jul. 2021. [Online]. Available: https://doi.org/10.1007/s13755-021-00163-7 [22] K. Dlshad Ahmed and R. Hawezi, “Detection of bone fracture based on machine learning techniques,” Measurement: Sensors, vol. 27, p. 100723, Jun. 2023. [Online]. Available: https://doi.org/10.1016/j.measen.2023.100723 [23] P. Rajpurkar, J. Irvin, A. Bagul, D. Ding, T. Duan, H. Mehta, B. Yang, K. Zhu, D. Laird, R. L. Ball, C. Langlotz, K. Shpanskaya, M. P. Lungren, and A. Y. Ng, “MURA: Large Dataset for Abnormality Detection in Musculoskeletal Radiographs,” in Proceedings of the 1st Conference on Medical Imaging with Deep Learning (MIDL). arXiv, 2017. [Online]. Available: https://doi.org/10.48550/arXiv.1712.06957 [24] R. Archana and P. S. E. Jeevaraj, “Deep learning models for digital image processing: a review,” Artificial Intelligence Review, vol. 57, no. 1, Jan. 2024. [Online]. Available: https://doi.org/10.1007/s10462-023-10631-z [25] P. Pandey, R. Gupta, and N. Goel, “Comprehensive review of single image defogging techniques: enhancement, prior, and learning based approaches,” Artificial Intelligence Review, vol. 58, no. 4, Jan. 2025. [Online]. Available: https://doi.org/10.1007/s10462-024-11034-4 [26] P. A C, L. S, and M. Somashekara, “An improve method for reconstruction and enhancing dar images based on clahe,” International Researc Journal on Advanced Science Hub, vol. 5 no. 02, pp. 40–46, Feb. 2023. [Online]. Available https://doi.org/10.47392/irjash.2023.011 [27] X. Liu, Comparison of Four Convolutiona Neural Network-Based Algorithms for Sport Image Classification. Atlantis Press Internationa BV, 2024, pp. 178–186. [Online]. Available: https://doi.org/10.2991/978-94-6463-370-2_20 [28] E. Riba, D. Mishkin, D. Ponsa, E. Rublee and G. Bradski, “Kornia: an open sourc differentiable computer vision library for pytorch, in Proceedings of the IEEE/CVF Winte Conference on Applications of Computer Visio (WACV). arXiv, 2019. [Online]. Available: https://doi.org/10.48550/arXiv.1910.02190
|
|
[29] R. Connor, A. Dearle, B. Claydon, and L. Vadicamo, “Correlations of cross-entropy loss in machine learning,” Entropy, vol. 26, no. 6, p. 491, Jun. 2024. [Online]. Available: https://doi.org/10.3390/e26060491 [30] M. Dörrich, M. Fan, and A. M. Kist, “Impact of mixed precision techniques on training and inference efficiency of deep neural networks,” IEEE Access, vol. 11, pp. 57 627–57 634, 2023. [Online]. Available: https://doi.org/10.1109/ACCESS.2023.3284388 [31] A. Thakur, H. Chauhan, and N. Gupta, “Efficient resnets: Residual network design,” in NYU Tandon School of Engineering, Tech. Rep. arXiv, 2023. [Online]. Available: https://doi.org/10.48550/arXiv.2306.12100 [32] G. Fang, Y. Dai, Z. Lin, C. Zhou, J. Song, Y. Gu, X. Guo, A. Mao, and X. Kong, “An efficient unsupervised classification model for galaxy morphology: Voting clustering based on coding from convnext large model,” Astronomy & Astrophysics, vol. 693, p. A141, Jan. 2025. [Online]. Available: https://doi.org/10.1051/0004-6361/202451734 [33] A. Anaya-Isaza, L. Mera-Jiménez, and M. Zequera-Diaz, “An overview of deep learning in medical imaging,” Informatics in Medicine Unlocked, vol. 26, p. 100723, 2021. [Online]. Available: https://doi.org/10.1016/j.imu.2021.100723 [34] A. A. Mustapha and M. S. Yoosuf, “Exploring the efficacy and comparative analysis of one-stage object detectors for computer vision: a review,” Multimedia Tools and Applications, vol. 83, no. 20, pp. 59 143–59 168, Dec. 2023. [Online]. Available: https://doi.org/10.1007/s11042-023-17751-2 [35] Y. Nakamura, Y. Ishii, Y. Maruyama, and T. Yamashita, “Few-shot adaptive object detection with cross-domain cutmix,” in Proceedings of the European Conference on Computer Vision (ECCV). arXiv, 2022. [Online]. Available: https://doi.org/10.48550/arXiv.2208.14586 [36] M. T. Mora Cabral, R. G. Camero Berrones, and M. D. Arriaga Pons, “Modelo de identificación espacial de patrones de referencia empleando redes neuronales convolucionales (cnn) y entrenamiento por lotes,” Revista de investigación multidisiplinaria, Iberoamericana, no. 4, Dec. 2024. [Online]. Available: https://doi.org/10.69850/rimi.vi4.125
|
[37] A. Verma and B. Meenpal, T. andAcharya, “Computational cost reduction of convolution neural networks by insignificant filter removal,” Journal of Information Science and Technology, vol. 25, no. 2, pp. 150–165, 2022. [Online]. Available: https://upsalesiana.ec/ing35ar2r37 [38] C. Guo, R. Zhang, J. Xu, J. Leng, Z. Liu, Z. Huang, M. Guo, H. Wu, S. Zhao, J. Zhao, and K. Zhang, “Gmlake: Efficient and transparent gpu memory defragmentation for large-scale dnn training with virtual memory stitching,” in arXiv preprint. arXiv, 2024. [Online]. Available: https://doi.org/10.48550/arXiv.2401.08156 [39] V. D. Gil-Vera and C. Seguro-Gallego, “Machine learning aplicado al análisis del rendimiento de desarrollos de software,” Revista Politécnica, vol. 18, no. 35, pp. 128–139, Apr. 2022. [Online]. Available: https://doi.org/10.33571/rpolitec.v18n35a9 [40] F. D. Valle-Medina, L. J. Castillo-Heredia, M. A. Correa-Peralta, and J. E. Guzmán-Seraquive, “Clasificación de enfermedades en hojas de papa utilizando transformadores de visión,” Novasinergia Revista digital de Ciencia, Ingeniería y Tecnología, vol. 8, no. 1, pp. 142–156, Jan. 2025. [Online]. Available: https://doi.org/10.37135/ns.01.15.06
[41] M. Ihme, W. T. Chung, and A. A. Mishra, “Combustion machine learning: Principles, progress and prospects,” Progress in Energy and Combustion Science, vol. 91, p. 101010, Jul. 2022. [Online]. Available: https://doi.org/10.1016/j.pecs.2022.101010 [42] D. Patiño-Pérez, L. Armijos-Valarezo, L. Chóez- Acosta, and F. Burgos-Robalino, “Convolutional neural networks for diabetic retinopathy detection,” Ingenius, no. 33, pp. 91–101, Mar. 2025. [Online]. Available: https://doi.org/10.17163/ings.n33.2025.08 [43] G. Bauce and M. Moya-Sifontes, “Análisis de la curva ROC en la evaluación de indicadores antropométricos,” Revista Digital de Postgrado, vol. 11, no. 1, Aug. 2021. [Online]. Available: https://doi.org/10.37910/RDP.2022.11.1.e333 [44] G. B. Jaén Armijos, “Clasificadorfracturasextremidadessuperiores,” Github, oct 2025, gitHub repository. [Online]. Available: https://upsalesiana.ec/ing35ar2r44 |